


cb3723
Headphoneus Supremus
- Joined
- Mar 6, 2014
- Posts
- 1,562
- Likes
- 16
Can you also add an aromatherapy feature? And maybe a coffee maker?
Nice oneWe could milk this for comedy value from here for a while but I think Aromatherapy and Coffee making options are a great idea, two very important things to me hehe

Well, class A could pop corn
Dudes!
You're on my level...
[VIDEO]http://youtu.be/hmP7TYtDVUU[/VIDEO]
Particularly like the coffee maker suggestion

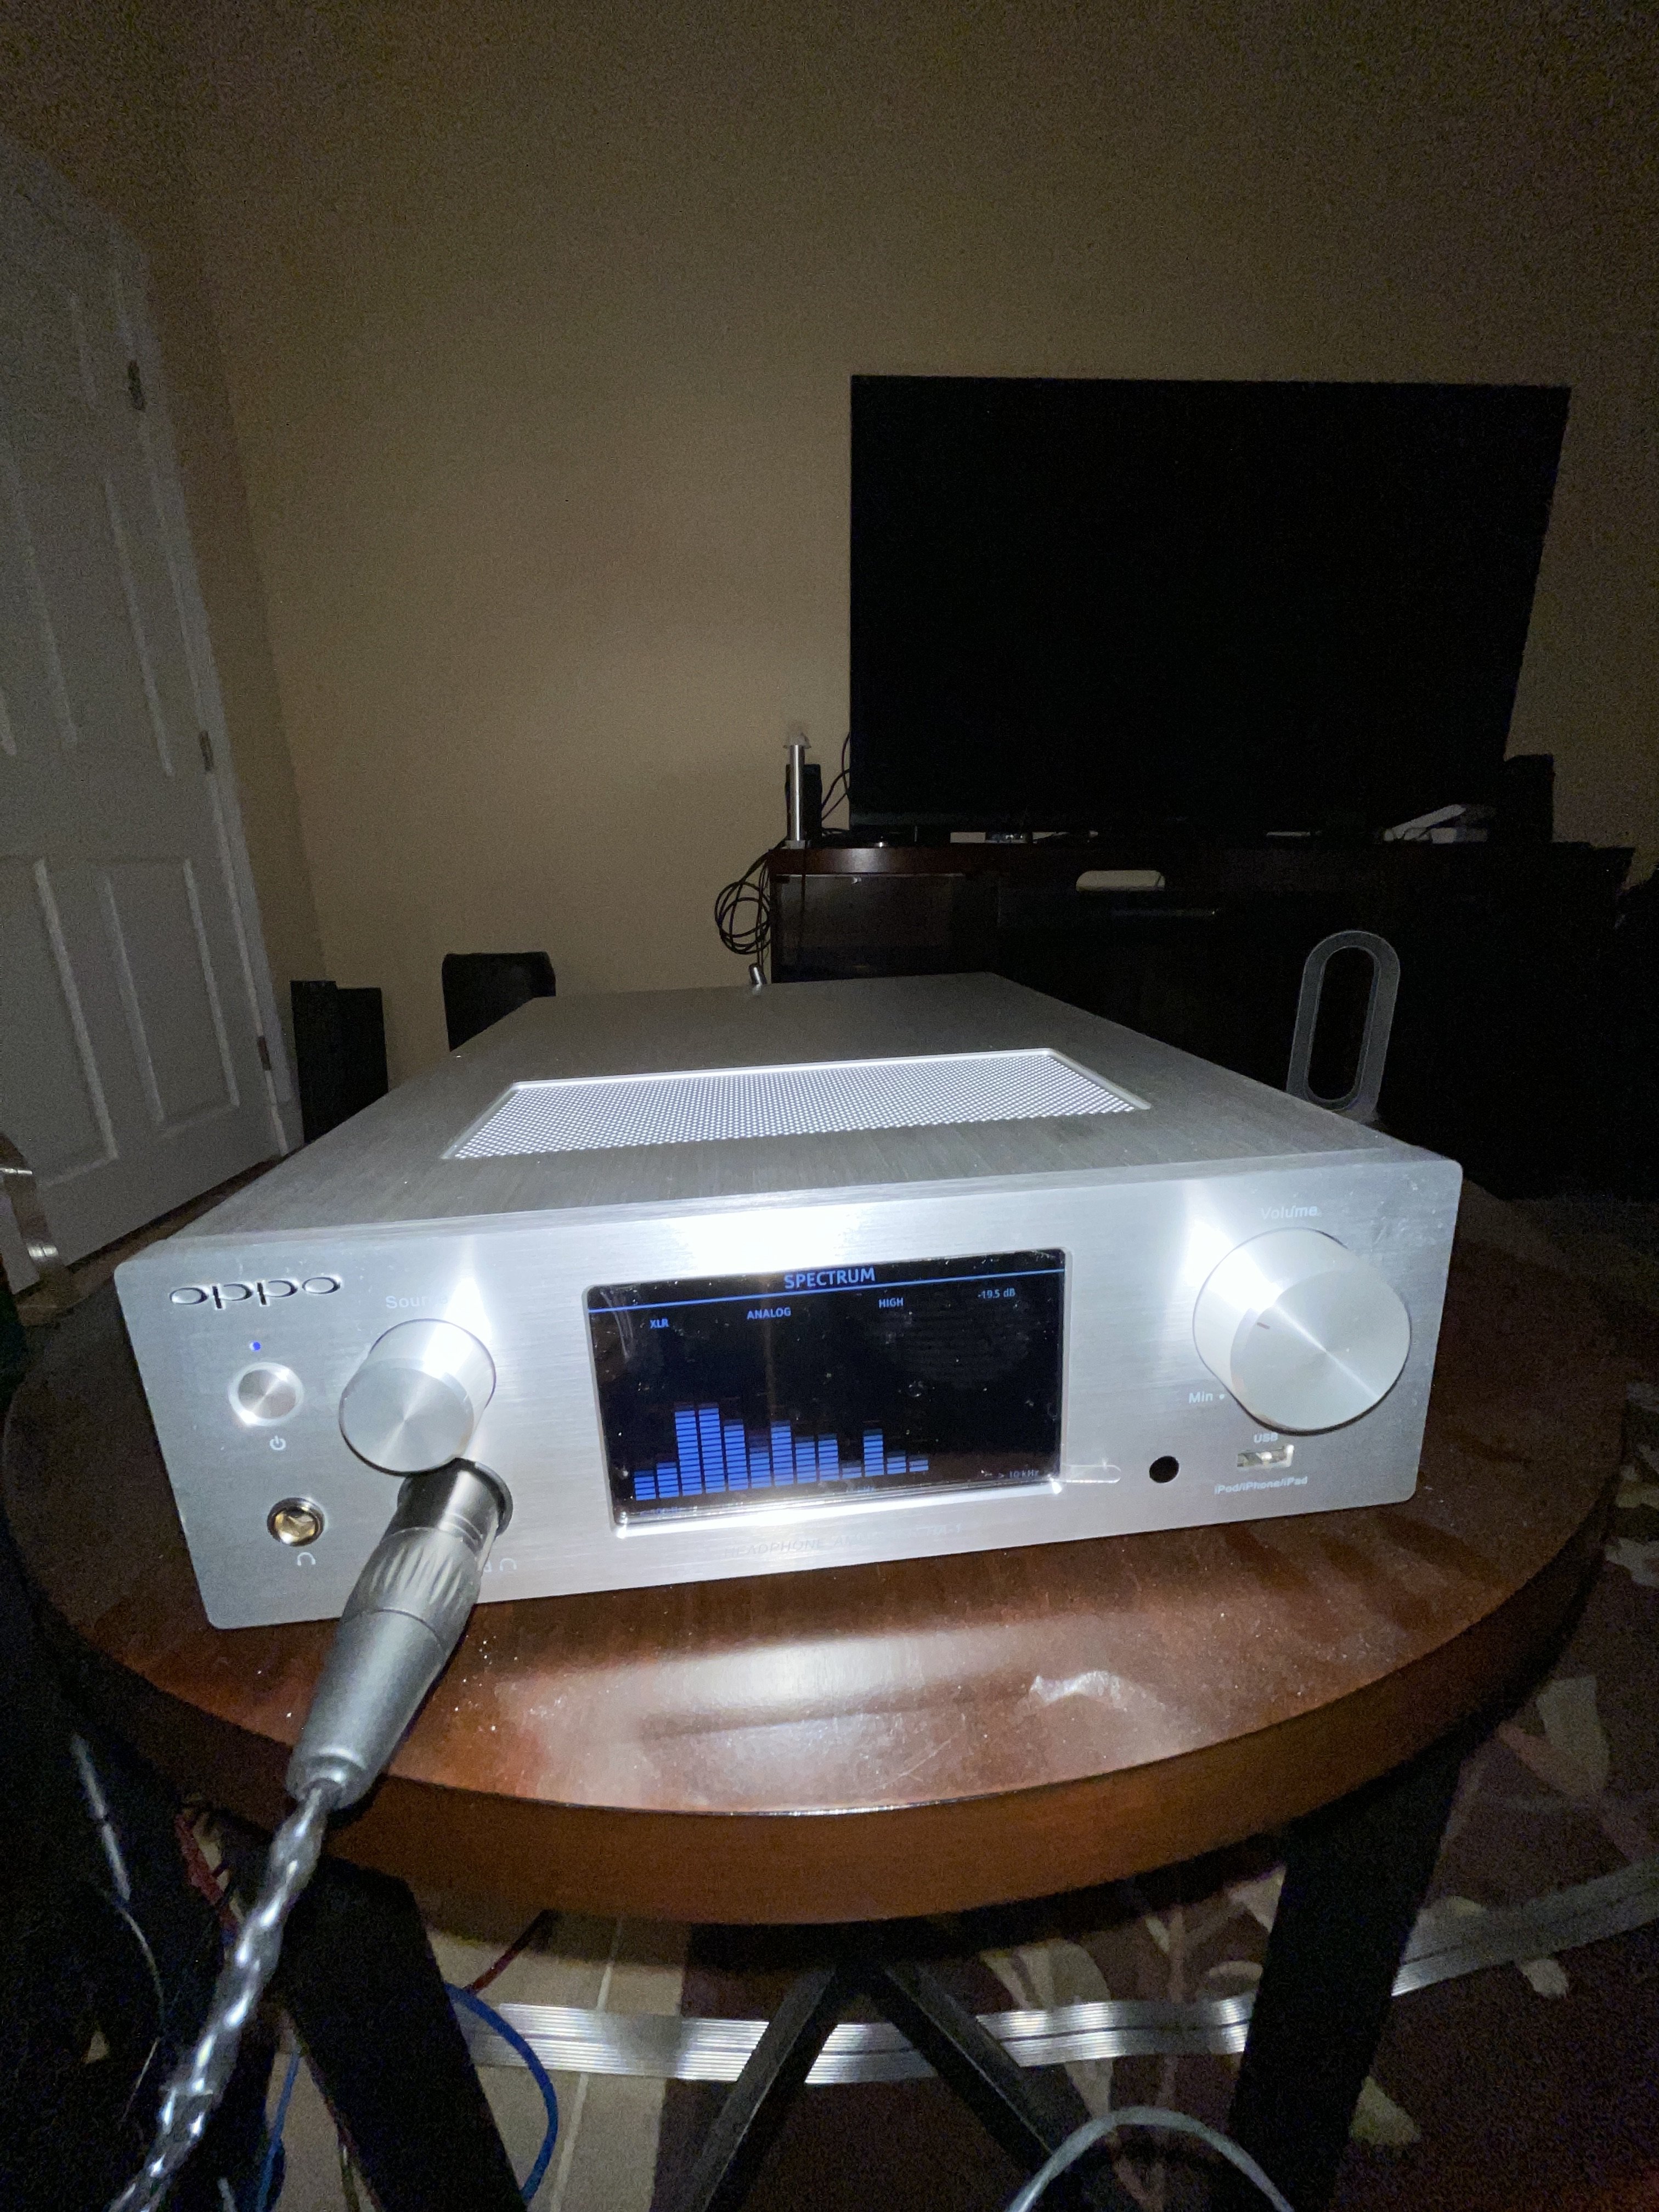
 But I'd REALLY like to see individual bands down to 20Hz...let's say, "20Hz, 30Hz, 40Hz, 50Hz, 60Hz, 80Hz, 100Hz", or at least start the low end display at 30Hz. I don't mind that each of the "bars" would become thinner or narrower. IMO, there is A LOT happening below 100Hz that I would really like to see (individual bands, not everything <100Hz grouped together).
") I just might be persuaded to purchase one .
I just might be persuaded to purchase one . 