


feifan
1000+ Head-Fier
- Joined
- Sep 10, 2006
- Posts
- 1,337
- Likes
- 35
Quote:
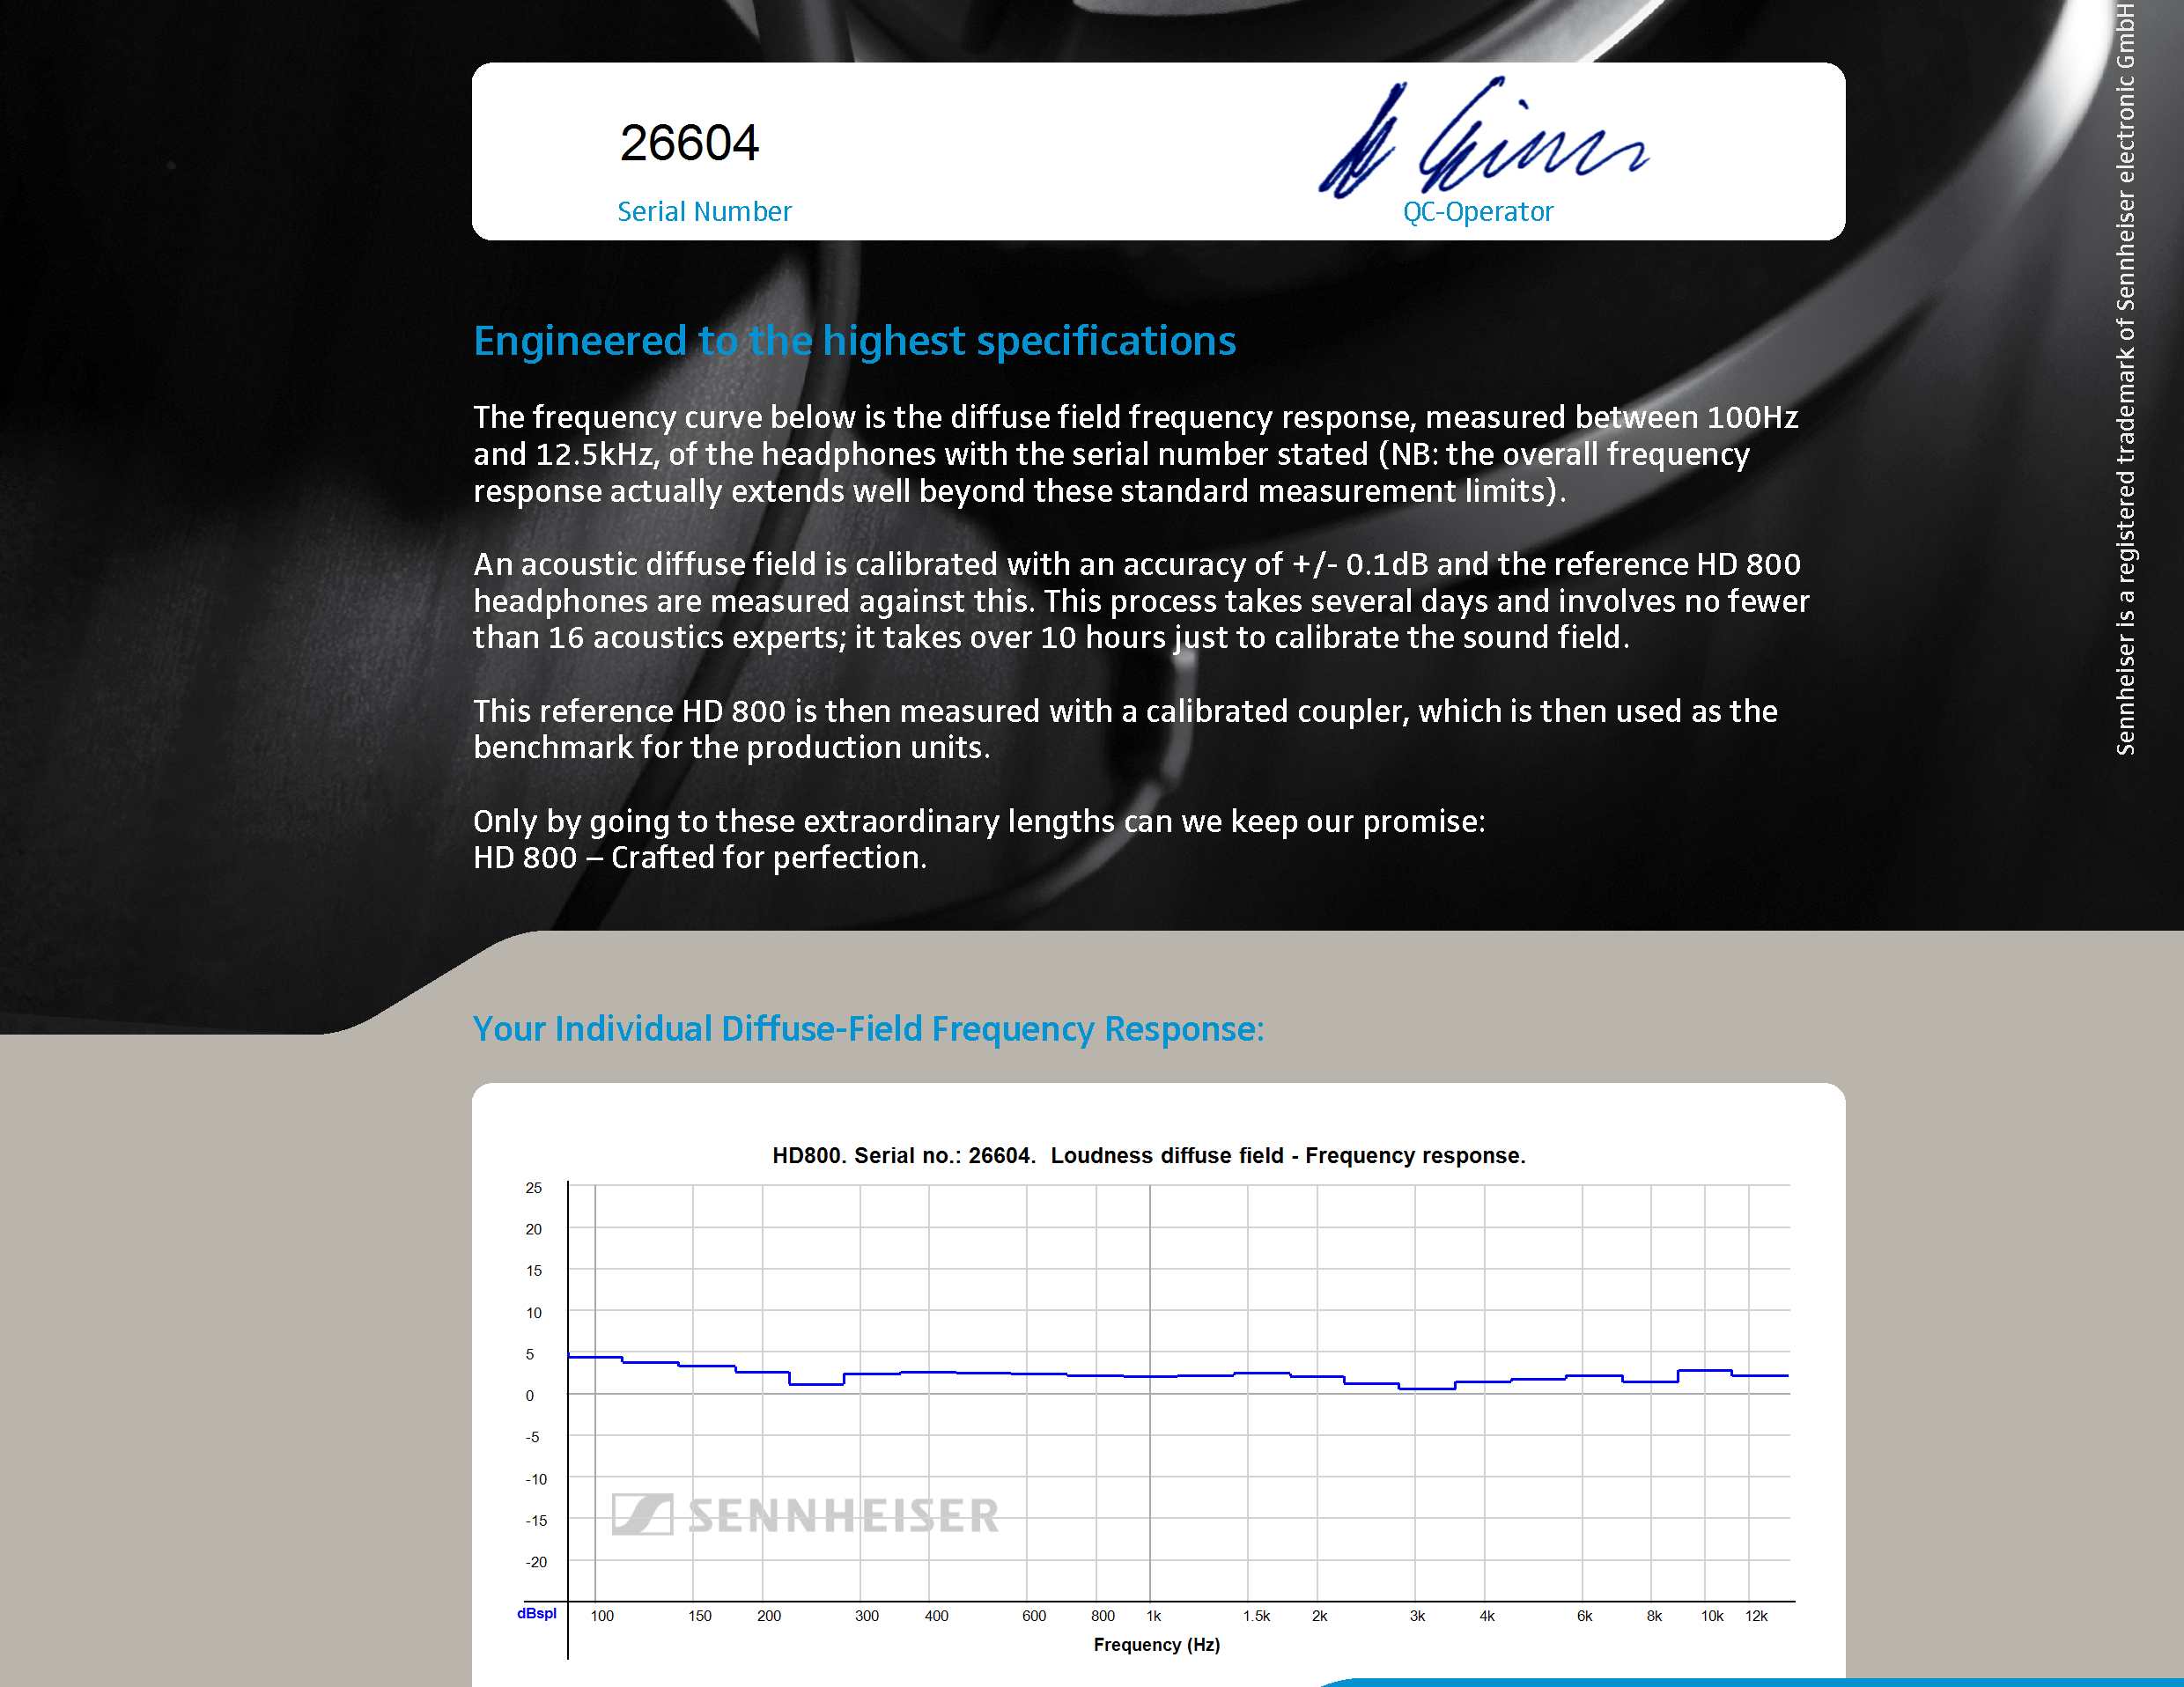
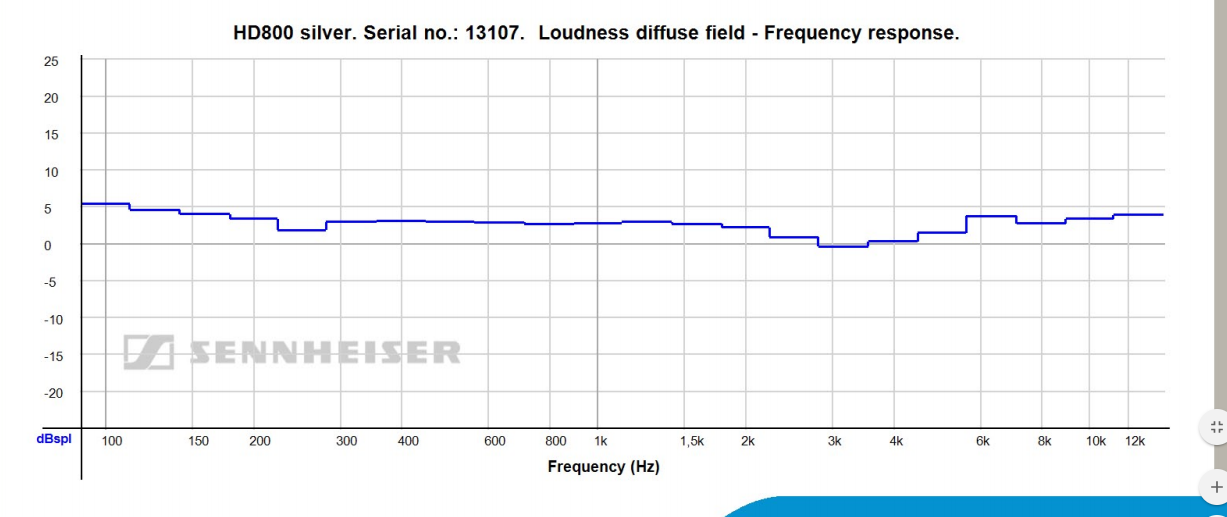
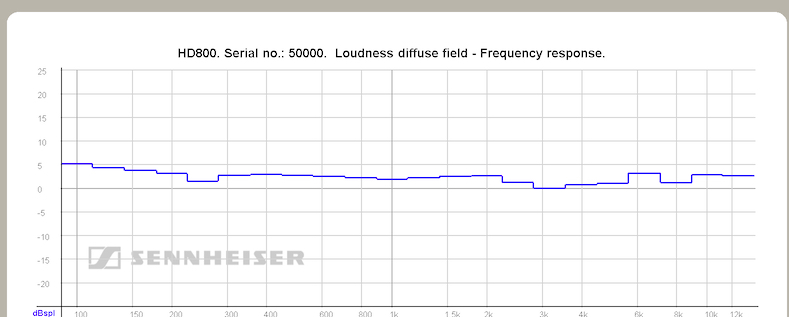
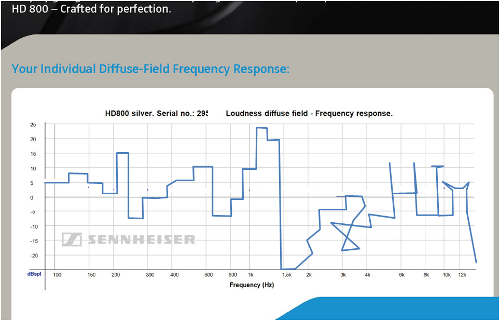
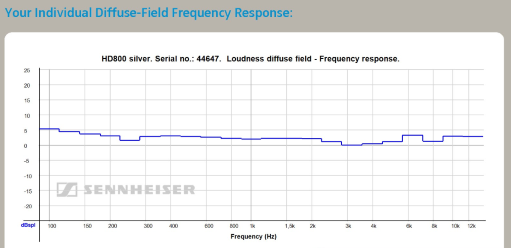
Hi, raccoon. I'll accept your reprimand with appreciation if I'm reassured that you've read the entire exchange instead of this one comment. For a synopsis, please see my post #114. Also see shellylh's and Hopstretch's recent comments re their early HD800 serial numbers. Skylab's comment, which began this subthread, denigrates our (and all the other) HD800s with early serial numbers. And this is based on what he calls an "obvious spike" at 6kHz, which cripples them severely and, in essence, makes them worthless. My point to Skylab is that a spike is a visual impression that is relative to the rest of the curve. In all the posted charts, when the "spike" is viewed from the perspective of the entire curve, it is not a spike because it lines up with the flat curve. The 6kHz frequency list I provide explains just how far off the individual frequencies are from the flat. Based on this sample, the variation from flat is very slight.
Re the "spike" that appears as a result of the 3kHz dip -- I mention this from my initial post in this subthread. Yes, if viewed against the 3kHz dip, the 6kHz frequency appears to be a spike. But, again, if viewed from the perspective of the entire graph, the 6kHz "spike" disappears since it lines up nearly perfectly with the flat.
Finally, I point out that the 3kHz dip may be an interesting topic to pursue.
I appreciate your taking the time to comment, and I hope you'll give me a fair shake by carefully reviewing the pertinent posts. And if you still feel the same after you've done so, then I'll accept your graceful censure.
| Originally Posted by raccoon /img/forum/go_quote.gif You're being a bit rude, which isn't necessary. He's saying he's read your posts, but disagrees with what you're saying - no point in comparing the levels at 200Hz with 6KHz and saying since they're nearly the same that there isn't a spike. You have to look at the 6Khz region to the frequencies immediately before and after. He also noticed this spike when testing the headphones, well before these graphs came out. I got my graph (I'll eventually upload it) and there's definitely a spike in mine. I don't notice it when listening to my pair, or maybe I do but prefer it. Who knows. Some people are sensitive to this, such as Skylab, and these graphs help explain those spikes people are hearing. No need to get defensive. |
Hi, raccoon. I'll accept your reprimand with appreciation if I'm reassured that you've read the entire exchange instead of this one comment. For a synopsis, please see my post #114. Also see shellylh's and Hopstretch's recent comments re their early HD800 serial numbers. Skylab's comment, which began this subthread, denigrates our (and all the other) HD800s with early serial numbers. And this is based on what he calls an "obvious spike" at 6kHz, which cripples them severely and, in essence, makes them worthless. My point to Skylab is that a spike is a visual impression that is relative to the rest of the curve. In all the posted charts, when the "spike" is viewed from the perspective of the entire curve, it is not a spike because it lines up with the flat curve. The 6kHz frequency list I provide explains just how far off the individual frequencies are from the flat. Based on this sample, the variation from flat is very slight.
Re the "spike" that appears as a result of the 3kHz dip -- I mention this from my initial post in this subthread. Yes, if viewed against the 3kHz dip, the 6kHz frequency appears to be a spike. But, again, if viewed from the perspective of the entire graph, the 6kHz "spike" disappears since it lines up nearly perfectly with the flat.
Finally, I point out that the 3kHz dip may be an interesting topic to pursue.
I appreciate your taking the time to comment, and I hope you'll give me a fair shake by carefully reviewing the pertinent posts. And if you still feel the same after you've done so, then I'll accept your graceful censure.


