


Skylab
Reviewerus Prolificus
Feifan:
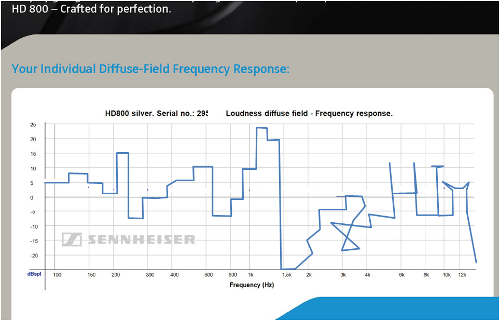
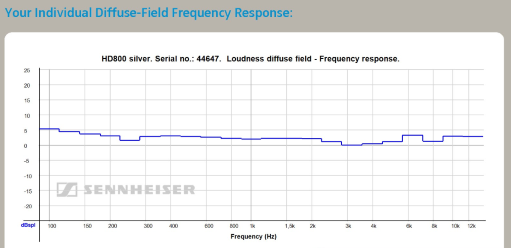
I have agreed that the FR data can't "prove" anything. However, your list above has no meaning, since you did not indicate a reference frequency. Against what frequency band are you basing your "nearly equal" or "very slight rise" on? The adjacent band? That is NOT what the graphs show. The average of the entire rest of the FR? And if the latter, did you actually take an average, or are you just eyeballing it? If you are going to try to present data to counter my statement in that way, you will need to present the data more precisely
 Not trying to be rude here, but I do get the chance to reply to your counter, and what you have presented isn't very useful without more detail. Otherwise, it's just grandstanding to try to "prove" the HD800 doesn't have any flaws.
I also disagree that the comparison to the adjacent band isn't meaningful, and that isn't a realistic argument. There is no question that the changing of level from one frequency band to the next is audible. The only question is HOW audible. It's hollow to argue that in order to be audible, a peak or dip has to be higher than EVERY other frequency band.
And while I have a lot of respect for k3oxkjo, the mere fact that "he said so" does not make it true, Feifan. I worked for a transducer company for 8 years, and I have more than just a small working knowledge of the effects of small frequency response changes in a transducer. So k3oxkjo has his opinion, and I have mine - both are informed opinions, and there is no way to prove that one or the other is correct.
I have agreed that the FR data can't "prove" anything. However, your list above has no meaning, since you did not indicate a reference frequency. Against what frequency band are you basing your "nearly equal" or "very slight rise" on? The adjacent band? That is NOT what the graphs show. The average of the entire rest of the FR? And if the latter, did you actually take an average, or are you just eyeballing it? If you are going to try to present data to counter my statement in that way, you will need to present the data more precisely
I also disagree that the comparison to the adjacent band isn't meaningful, and that isn't a realistic argument. There is no question that the changing of level from one frequency band to the next is audible. The only question is HOW audible. It's hollow to argue that in order to be audible, a peak or dip has to be higher than EVERY other frequency band.
And while I have a lot of respect for k3oxkjo, the mere fact that "he said so" does not make it true, Feifan. I worked for a transducer company for 8 years, and I have more than just a small working knowledge of the effects of small frequency response changes in a transducer. So k3oxkjo has his opinion, and I have mine - both are informed opinions, and there is no way to prove that one or the other is correct.
.gif)