


- Joined
- Aug 2, 2008
- Posts
- 5,408
- Likes
- 1,327
Quote:
Sorry, I feel like a complete idiot trying to decipher these graphs. So, I take it the DJ100 measured very poorly..oh well..
I did expect a lot of spikes near the upper mids and my ears hear this too. I kind of like it though. Certainly it's no studio monitor
LOL. I'm going to re-measure them at the request of the owner. I could have messed up on something. They don't sound as bad as the graphs suggest.
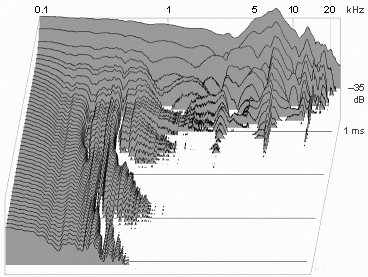
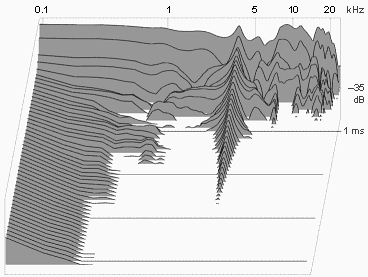
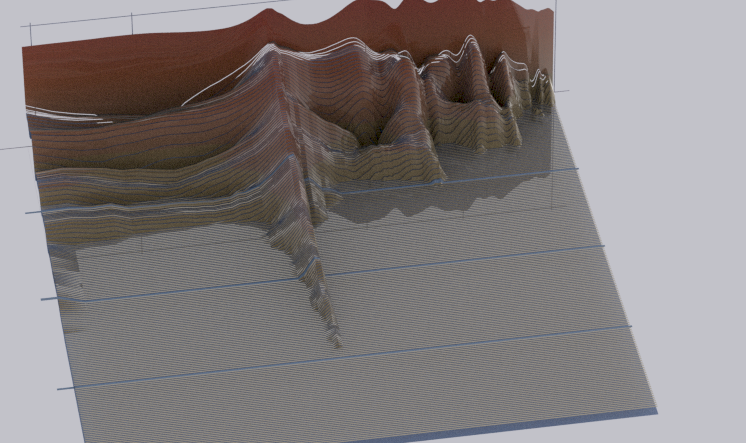
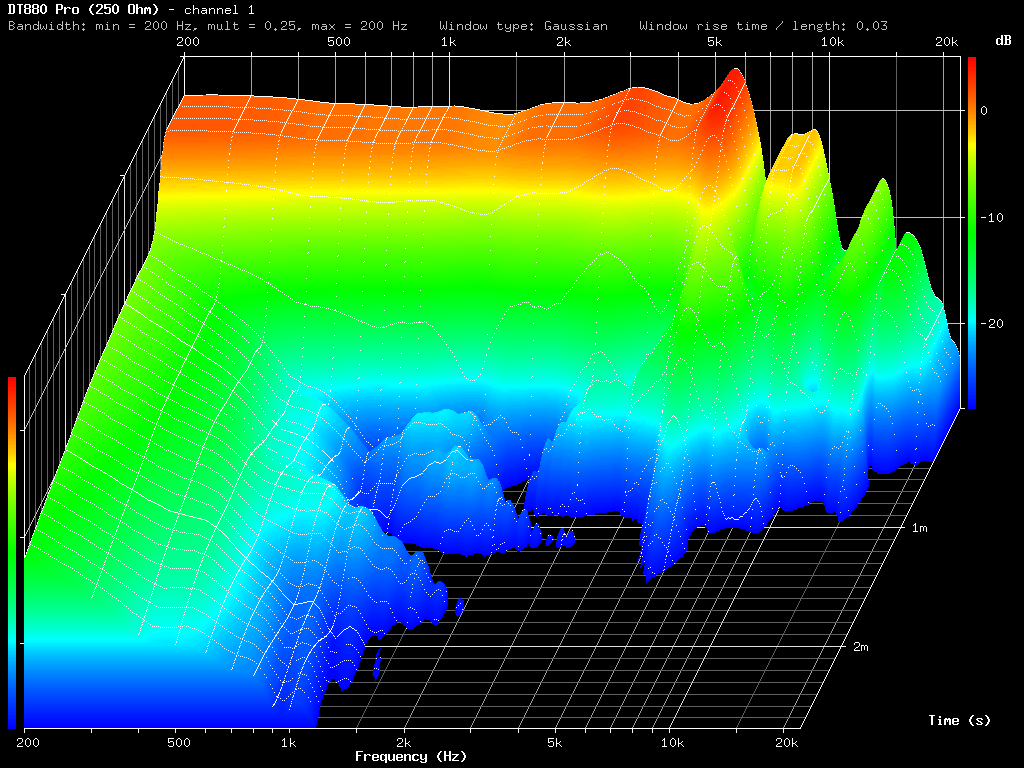
The CSD plots measure energy content over time across all frequencies based on a "sound burst" that excites all frequencies. They are sort of like a FR over time (technically not really as they measure energy throughout the band in successively smaller windows over time.) It is a good tool to "see" driver ringing (seen as ridges), which typically sounds bad, and to see how fast the driver decays. See this post for what a perfect waterfall plot might look similar to. For a perfect response, the decay should be immediate. You see a wall (meaning all frequencies are excited) at the beginning. The next few fractions of a millisecond, you see the wall fall to absolutely nothing. It's very evident that headphone drivers are far from ideal. Some much less ideal than others.


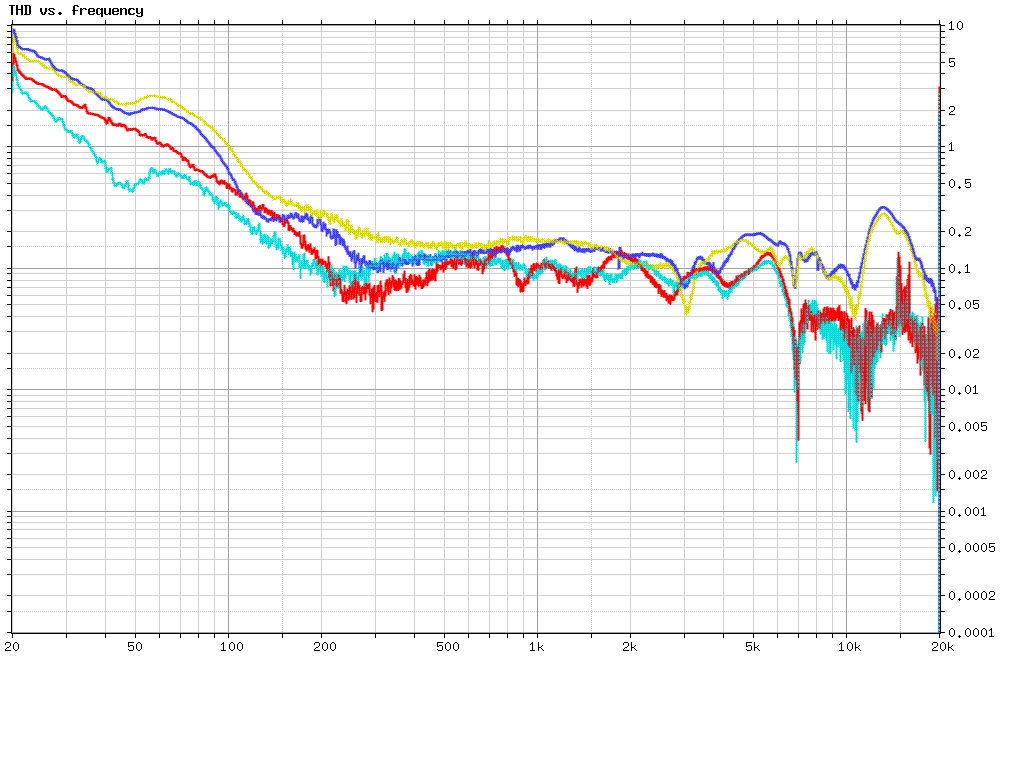
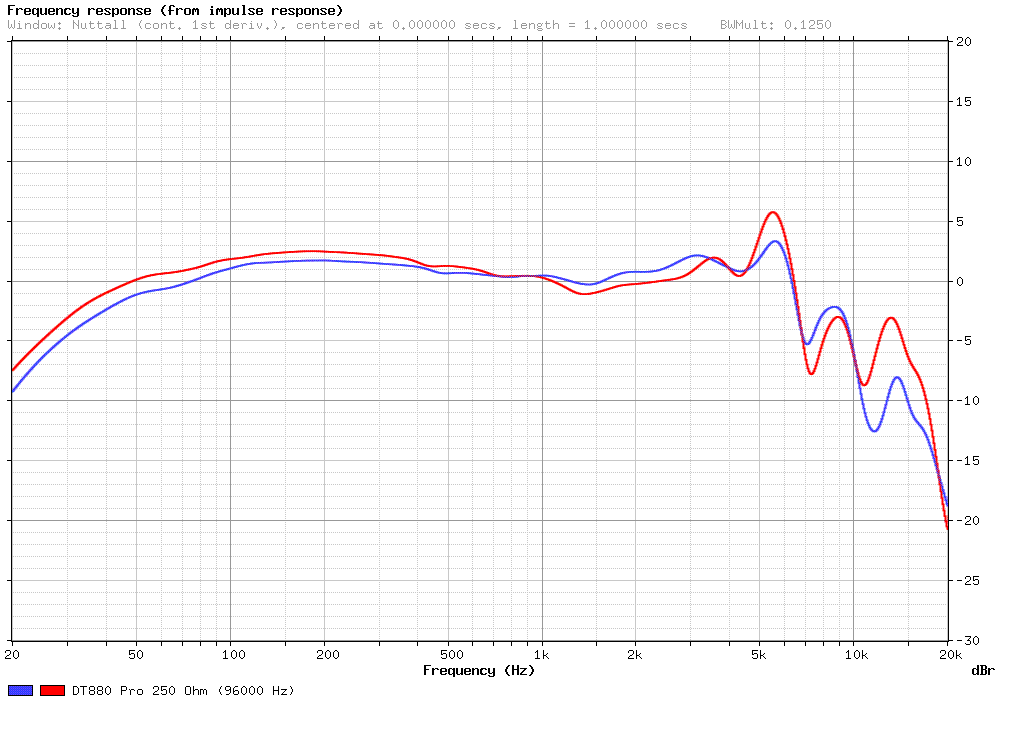
 . Even more interesting is the fact that you could consider the peak is begnin if only looking at the usual frequency response graph.