


- Joined
- Aug 2, 2008
- Posts
- 5,408
- Likes
- 1,327
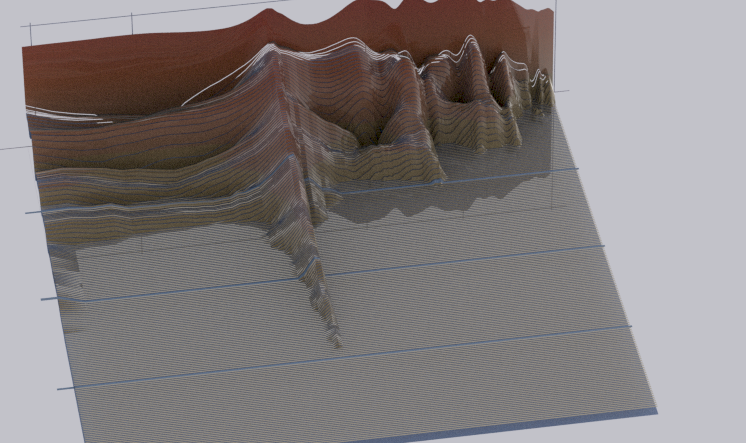
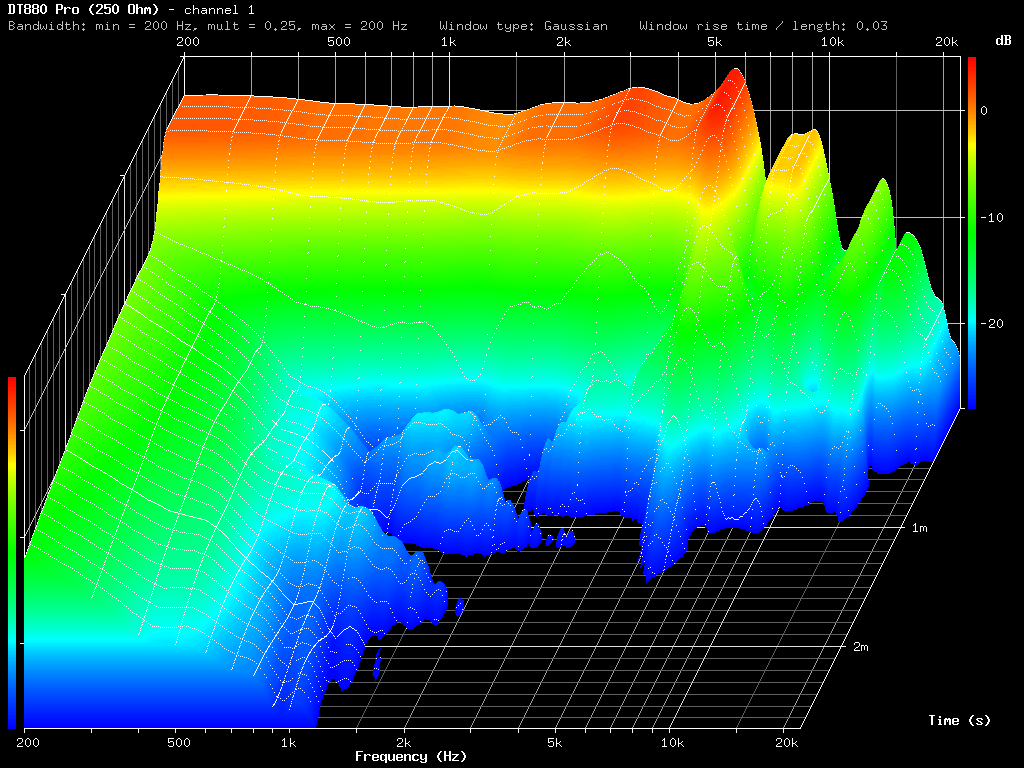
OK, here are the "Jazz Mod" results. JaZZ used velvet. Arnaud used foam of varying thicknesses (on the plastic not on the ring). Here, I used one layer of adhesive backed felt on the plastic section at the back of the cup, and two layers on the metal circle surrounding the drivers:

Again, take these graphs with a grain of salt and know that any comparisons with other measurements (even my own if taken at a later time) would be invalid. I usually take several types of measurements (MLS, sweep, RTA/FFA) and merge the data together. For these graphs, I didn't perform any massaging of the data; but they are good enough for the purposes of this comparison.
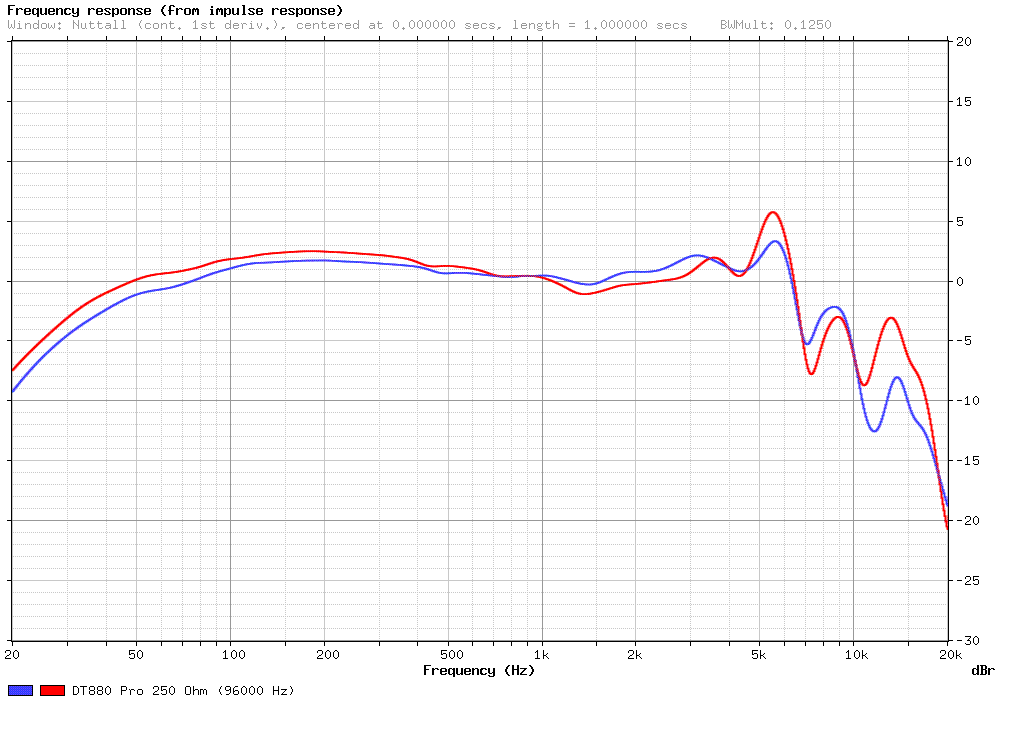
FR graph first:

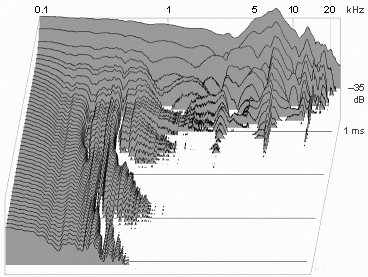
HD800 No Mods:

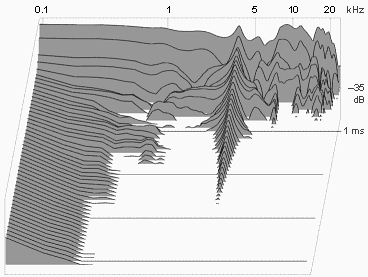
HD800 w/ mods:
The red splotches are smaller and the green doesn't push out as much at 5-6KHz. Note the greater uniformity in color horizontally (L-R) across the plot between 0.0 to 0.50ms. This is important.

Quote:
Haha! I'm still using an old version with the ISA card on a P3 box. The box is a little on the noisy side and if I expand the time window on the CSDs enough, you can see the whine of the fans! (EDIT: LOL, you can actually see them in the first few waterfall plots in the first post. I've since taken steps to block out this source of noise.) I think the CLIO manufacturer updated it so it's got a USB thingy now.
Quote:
I was going to measure these before I sold my rev1s a while back, but I was too lazy. I'm sure someone in the neighborhood has a pair. I would definitely like to measure these.
Again, take these graphs with a grain of salt and know that any comparisons with other measurements (even my own if taken at a later time) would be invalid. I usually take several types of measurements (MLS, sweep, RTA/FFA) and merge the data together. For these graphs, I didn't perform any massaging of the data; but they are good enough for the purposes of this comparison.
FR graph first:
HD800 No Mods:
HD800 w/ mods:
The red splotches are smaller and the green doesn't push out as much at 5-6KHz. Note the greater uniformity in color horizontally (L-R) across the plot between 0.0 to 0.50ms. This is important.
Quote:
Originally Posted by arnaud /img/forum/go_quote.gif
I used Clio a loooong time ago while working for a speaker manufacturer, does that even run on modern PCs?.
Haha! I'm still using an old version with the ISA card on a P3 box. The box is a little on the noisy side and if I expand the time window on the CSDs enough, you can see the whine of the fans! (EDIT: LOL, you can actually see them in the first few waterfall plots in the first post. I've since taken steps to block out this source of noise.) I think the CLIO manufacturer updated it so it's got a USB thingy now.
Quote:
Does anyone want to lend purrin their LCD-2s?
I was going to measure these before I sold my rev1s a while back, but I was too lazy. I'm sure someone in the neighborhood has a pair. I would definitely like to measure these.


