Headphone CSD waterfall plots
Oct 13, 2012 at 7:12 PM Post #811 of 937
Quote:
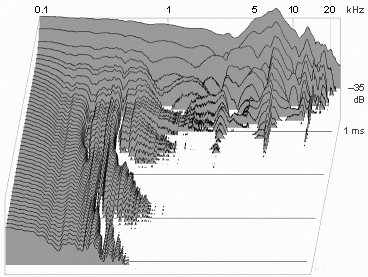
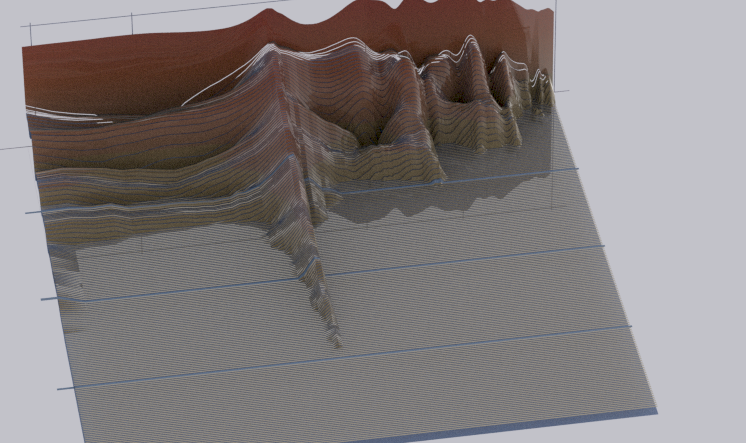
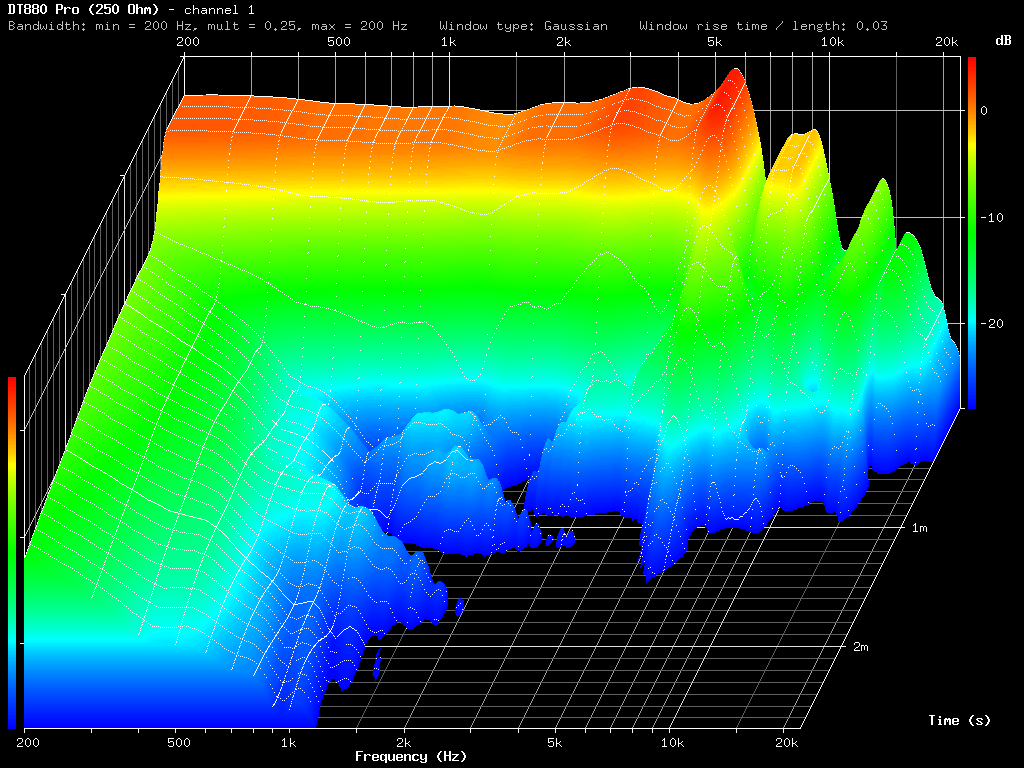
Some tweaks again to the plots. The perspective is closer to orthographic, there's an additional top-down view that extends down to 7 ms, bigger ridges are individually marked for frequency again, and the color scheme was changed a little, though not much.
 
AKG K 250 modded with a nylon disc in the cup (not a big effect) and another nylon disc in front of the driver (a bigger effect):
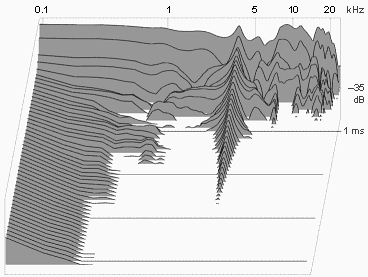
 
Original K 250:

 
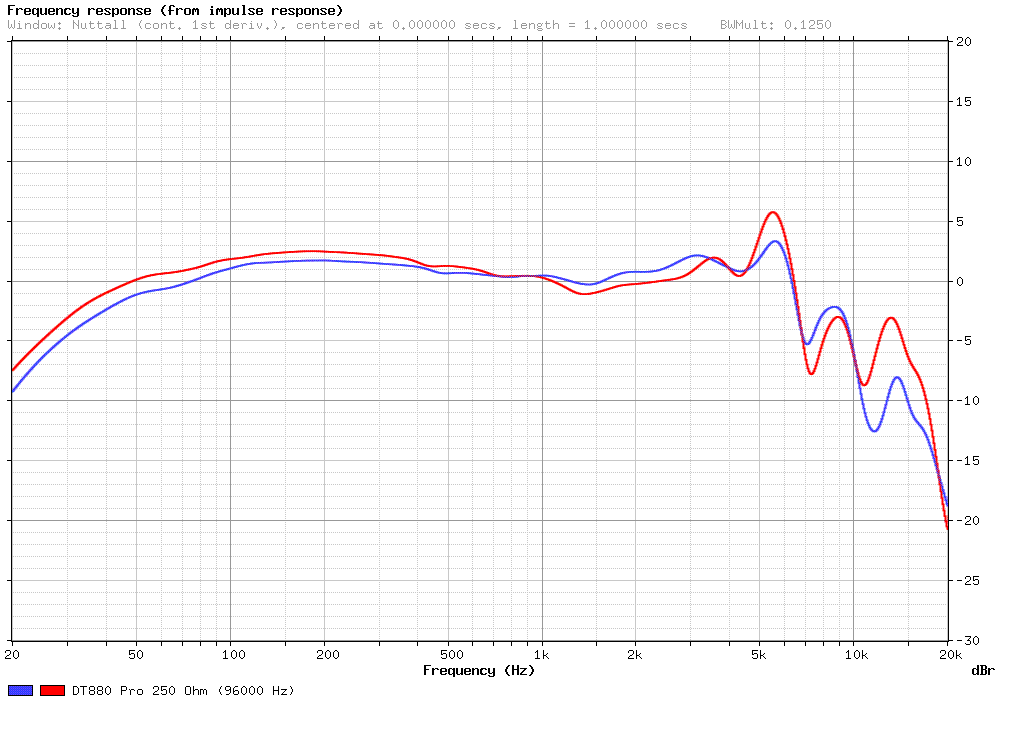
It's a good driver with a few problems. The 4.5 kHz peak is interesting in that its frequency isn't affected by the ear's anatomy - it's asking for some EQ later on.
 
AKG K 240 DF again, for reference in the new design:

Like the approach a lot! The colour scheme is horrible though...neither the dull green nor the brick red really accentuate the plot. You could maybe try a few different colour combinations of the same plot, and post em here, so everyone can suggest what works best to present these plots.
 
Oct 13, 2012 at 7:28 PM Post #812 of 937
Thanks for the honest feedback, jerg (no pun), I do appreciate it. I actually like the colors to some degree, though - and in fact I find myself gravitating away from using accentuating colors (if by accentuating you mean high contrast, like deep blue and pale yellow). It's kinda bad for readability to lower contrast like I'm doing, but that's also partly why I put the top-down view in.
 
Implementing various color schemes via code is a ton of work - maybe you could photoshop up a picture with color bands or something representing the type of color gradient you most prefer?
 
Oct 13, 2012 at 7:33 PM Post #813 of 937
I plan on finishing up what I had started on the other site with minimum phase removal of the dummy head effect and plot the resulting CSD. I can bet you though that a flat correction like xnor did, even if using minimum phase assumption for the filter will lead just the same thing (a wall in the CSD). Only things showing up may be those resonances that are not visible in the FR response because too low in amplitude (and thus uncompensated).
 
Oct 13, 2012 at 9:13 PM Post #816 of 937
There must be something else to it, though. At the very least doing individual, isolated tone pulses and measuring their decay individually (there's an actual name for this method too) should give you a visual on ringing per each tested frequency - but would/should a CSD be different, and how?
 
Oct 13, 2012 at 10:03 PM Post #818 of 937
I've seen thread on convolving by FIR, though I'm not sure if the question of what the CSD actually shows came up... I.e. when a CSD plot shows an extended ridge, is it because the driver was ringing or is it because there was a spike in the frequency response (no causal link by necessity)?
 
Oct 13, 2012 at 10:22 PM Post #819 of 937
I posted something today discussing the difference / similarities between csd and time decay measurements (which goes along the lines of looking at te decay of each separetely excited frequency.

As to the differentiation between driver ringing and resonance in the FR response, they're one and the same if the FR peak is a result of a driver resonance. The Q factor in the FR response (sharpness of the ridge) and the frequency at which it occurs is directly related to how long it will ring in the time domain. If the response is perfectly flat from DC to GHz range except for a single peak sticking out, you will see a perfect pulse in the time domain except for this decaying sinusoidal tail. The sharper the peak in the FR, the longer it will take for the tail to decay and similarly longer the ridge in the CSD.

You might then say that the CSD doesn't bring anything to the table. Well, one is example is what I mentioned in above post: a resonance (driver or enclosure, doesn't matter but most likely an acoustic resonance), which does not directly shows up the FR but only after the first 5dB or so of initial decay. You may or may not see it in the impulse response because it's amplitude if quite a bit lower than the rest. Only a CSD can show this and purrin has numerous examples on his site.
 
Oct 13, 2012 at 11:03 PM Post #820 of 937
Thanks for the explanation, I'll refer to it as I slowly wrap my head around CSD. I also don't mean to question the usefulness of CSD as such, I think it's a neat way to visualize.
 
Oct 13, 2012 at 11:54 PM Post #821 of 937
Quote:
There must be something else to it, though. At the very least doing individual, isolated tone pulses and measuring their decay individually (there's an actual name for this method too) should give you a visual on ringing per each tested frequency - but would/should a CSD be different, and how?

 
What's a "tone pulse" though--a tone doesn't just start and stop.  If you have e.g. silence and then just one cycle of a 1000Hz sine wave, that's not a "tone pulse at 1000Hz"--that's a broadband phenomenon, you can see it by plotting a spectrum of such an audio clip in Audacity.
 
HiBy Stay updated on HiBy at their facebook, website or email (icons below). Stay updated on HiBy at their sponsor profile on Head-Fi.
 
https://www.facebook.com/hibycom https://store.hiby.com/ service@hiby.com
Oct 14, 2012 at 7:02 AM Post #822 of 937
A tone starts and stops - why wouldn't it? But what you get from pushing a single cycle through FFT (what I assume Audacity is giving out) is a rough idea of where in frequency that energy is. How the decay (number of cycles) is calculated in those types of individual decay plots, I don't know.
 
Oct 14, 2012 at 7:52 AM Post #823 of 937
vid, the way it's done is like Joe said: you either feed it with white noise, stop it and record the time decay, else simply use the impulse response. Time Decay is typically looked at in 1/3 Octave Band and indeed gives you an idea of energy decay in that band (e.g. the average damping of all the modes resonating in that band).
 
Oct 14, 2012 at 9:47 AM Post #825 of 937
Quote:
 
What's a "tone pulse" though--a tone doesn't just start and stop.  If you have e.g. silence and then just one cycle of a 1000Hz sine wave, that's not a "tone pulse at 1000Hz"--that's a broadband phenomenon, you can see it by plotting a spectrum of such an audio clip in Audacity.

Isn't that a transient? I think vid is talking about another thing.
 

Users who are viewing this thread

Back
Top