Quote:
Originally Posted by ldj325 /img/forum/go_quote.gif
Terry, I am hoping that you will be willing to comment on something that you posted in another thread? See below:
"Terry's Long Post on Enjoyment
--------------------------------------------------------------------------------
Entice. Entrust. Enjoy. Enjoy your headphones. Enjoy your setup. Enjoy your music.
Terry"
Excellent post that I take at face value.
|
Thanks for putting it over into this thread where it belonged - that was bugging me! The original post is
over here if anyone wants to see my nice uses of italics and bold type!
Quote:
Originally Posted by ldj325 /img/forum/go_quote.gif
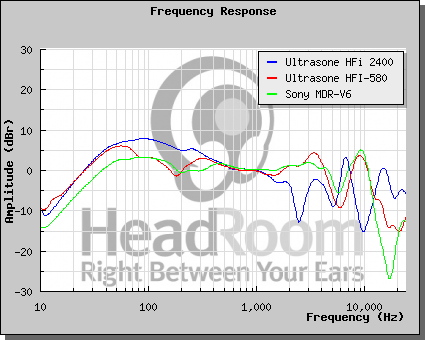
Here is what I am curious about. You reference the 750 giving close to the same sound as your studio monitors. In my limited experience, studio monitors often show a much flatter frequency graph than the ones for the 750. Also recently I saw a frequency graph for a well known IEM that would seem to indicate that they had a pretty good bass, yet they are generally known for having a very weak bass (and that is certainly my experience in listening to them).
I am getting the idea that there is a mis-match between the graphs (at least in how they are commonly used on Head-fi) and what real users actually experience. It looks like the graphs are misrepresenting what takes place as a listening experience, or they are being used incorrectly, or incomplete data is being given. Do you have any comments or clarification about this, especially as regards the Ultrasones?
(Now isn't that rather on point folks .)
|
From what I understand those frequency graphs are being taken the wrong way considering many, many factors - all of those being the ears and ear canal themselves. The graphs reflect the output of the drivers. That can be useful
perhaps to note where rolloffs and humps exist, but these all look very similar in several respects, do they not? Do any of them look "flat" in any way, shape or manner to you?
I'm pretty certain headphones have to be designed differently from speakers in several frequency-shaping areas due to their close proximity to the ear itself. What happens inside that narrow passageway is acoustically quite remarkable - it actually flattens out all of those dips and spikes above 1k. Those dips reflect resonances that have to be tamed, and the spikes reflect nodal regions where sound is self-canceling to a degree deep inside there. It's something to do with the curved and conical shape of the ear canal, and in Ultrasone's case, also the involvement with the pinnea, or outer ear folds.
So, what you're really seeing is a graph of compensations being made by the headphones. Whether or not they can be used to predict or analyze how a headphone is going to actually sound is dubious, IMO, if that is what those graphs portray. Resonant and nodal analysis curves of individual ears and ear canal shapes must be plugged into this to see how those factors straighten out the frequency response. I'm sure the industry uses some "theoretical model" of an actual ear to make these assumptions, then performs tests on real humans!
That, at least, is how those graphs were explained to me, but I cannot find my reference - it was probably over at
http://hydrogenaudio.com which is an audiophile site that seems to focus on the technical side of things more than others.
But that is my understanding of the limitations inherent in those graphs. Before people believe me just yet, please wait for other responses to this question to come in. My own sources may have been all-wet.
Terry