Hi Purrin,
Congratulations again for bringing concepts from loudspeaker design world to headphone testing.
Quote:
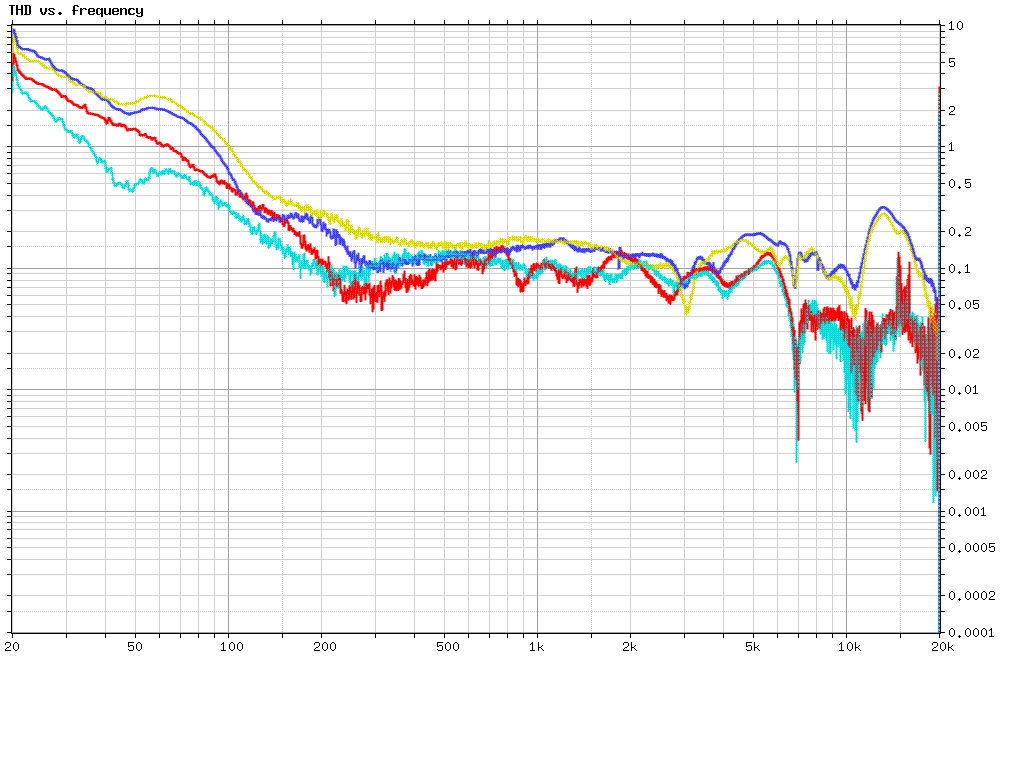
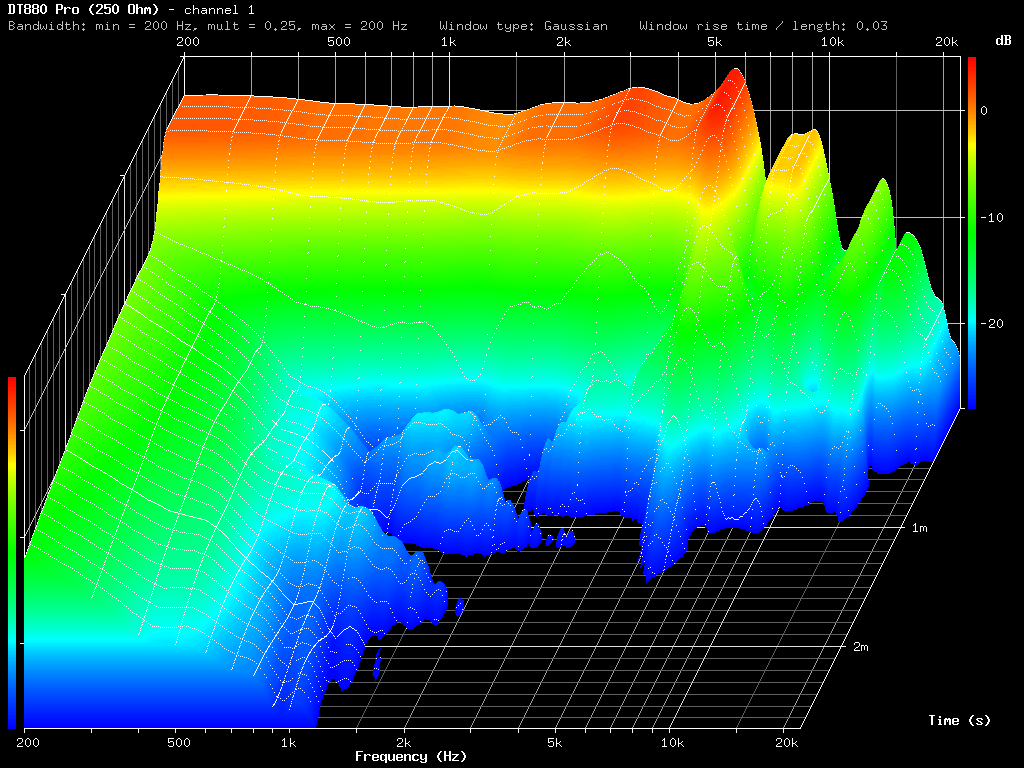
Oops. The last few sets (in blue lines) are not CSD waterfall plots, but non-linear distortion graphs. Basically I excite a few frequencies (run one to test tones). Ideally, on the RTAs, we should only see those two test tones. Anything else is non-linear distortion with harmonic distortion being an integer multiple of the signals and intermodulation distortion an integer multiple of the difference between two test tones.
I don't remember IMD being a key design parameter when selecting speaker drivers, is it always advertised as part of standard performance sheet?
What I don't understand is the meaning of such test for a transducer. For instance, I can see the meaning while looking at the behavior of electronic components. For example, hard clipping from an amplification stage should show up pretty well in the harmonic distortion graph

. Or, for low level signals I suppose some issues can occur when crossing the 0 line (when different components take care of the + and - components in the signal. DISCLAIMER: I am about as knowledgeable in electronics as an average turtle and it probably shows up in my post
).
On the other hand, for a speaker, you don't expect it to generate significant amounts of distortion when driven at a frequency due to the nature of the device:
- It really only vibrates AND radiates at the excitation frequency
- It does not suffer from hard clipping like electronics (you simply get some compression effect)
Any information you can share about the origins of these distortions for a transducer?
Another point of concern in your graphs is how much of the distortion is coming from the apparatus (amplification ...). Maybe you could add a reference plot with the output of clio (or better, that of the amp passed through an attenuator) fed into its input?
Quote:
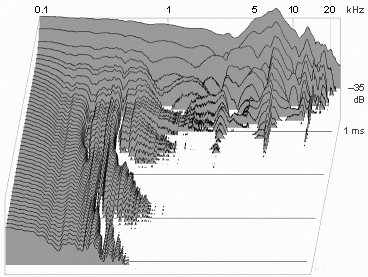
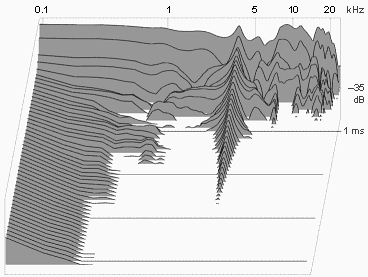
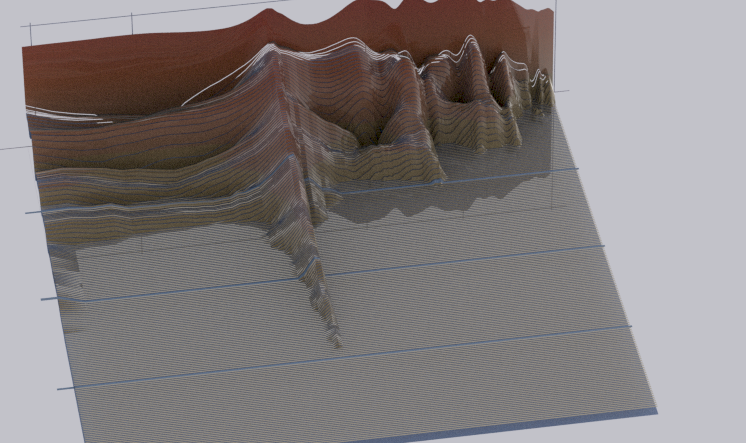
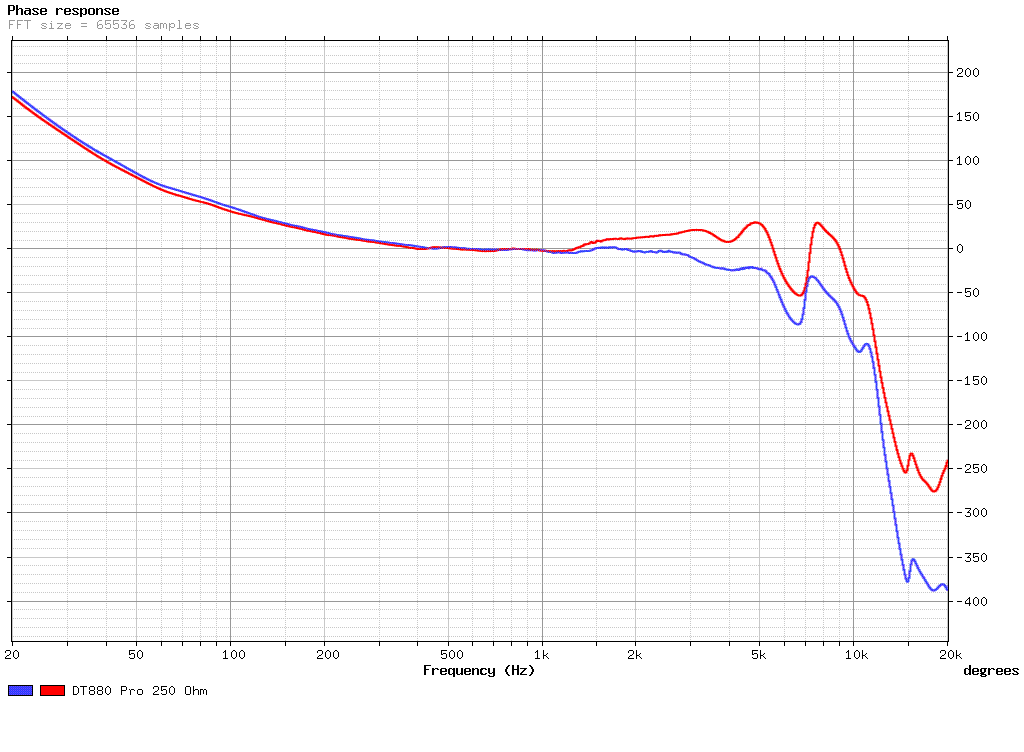
Driver response in terms of frequency, volume, and time (the axis coming toward us). Being able to see what happens over time time is more awesome than simply an FR.
The only caveat here is that these plots are not optimized for absolute correct FR. The measurement methods I employed attempt to remove the effect of the enclosures somewhat (thus less bass measured for closed phones.) I was more interested in seeing the speed of decay and effects of ringing on the driver than an accurate FR. Relative FR from one headphone to another (assuming that I measured it) can be inferred only if the enclosures are similar.
Marv, I reckon you started doing these tests on regular dummy head data and then found out you got cleaner results with your current anechoic termination test rig.
While I thought this was a great idea at first, I am not sure of the meaning after thinking a bit about it:
- There does not seem to be a fundamental issue with using a standard dummy head (see my CSD post-processing of Tyll's data)
- Headphones are (for the most part, grant you the K-1000 is a different beast) designed to feel an acoustic load forward of the driver (e.g. the acoustic chamber between the driver the ear due to earpad spacing).
I see several major issues with the anechoic termination test:
- As you pointed out, the low frequency part of your CSD plot has little to do with actual performance. (that's regardless of open or closed design, being in the acoustic near field of the driver, e.g. it's almost like doing an IEM test without a proper seal)
- The anechoic termination completely changes the acoustic resonances of the enclosure (from a sort of rigid boundary condition to anechoic one, acoustic resonances will shift down in frequency VERY significantly, by a factor of 2 for example). This will be seen up to very high frequency because such acoustic resonances occur above 2kHz.
- The anechoic termination adds significant acoustic absorption in the front chamber (ear to driver, bounded by the earpad) so the acoustic resonance of this region will not only be shifted in frequencies but also significantly damped so you pretty much won't see them in the CSD plot.
Have you thought about going back to standard dummy head measurement now that you got more experience with CSD testing? I understand you might want to isolated the driver resonances from the acoustic chamber but in this case, extracting the driver (like you did with the SR80?) or better yet, doing a laser vibrometer measurement on the diaphragm (can you get your hands on that ?
) would be suitable.
cheers,
arnaud