I had the chance to listen to two HD800 side by side at home on my system for more than a day. One of the phone had over 400h of use and the other was a brand new one out of the box. I can confirm without any doubts that there is a significant difference in the sound of the two sets. The sound of the new set was kind of in between the HD600 (which I also have at home for comparison) and broken-in HD800. The sound had not yet a fully extended and was lacking details. Contrarily to what is often reported, I did not find the new set to be crisper than the old one, just lacking extension and details. Speed may also be a tad slower on the new set.
Being able to compare the sets side by side should remove most of the psychoacoustics effect off the equation (It was not a blind A/B comparison but the difference was obvious enough). So either break-in is real or the specs of the Seenheiser HD800 varies wildly from set to set, which I doubt.
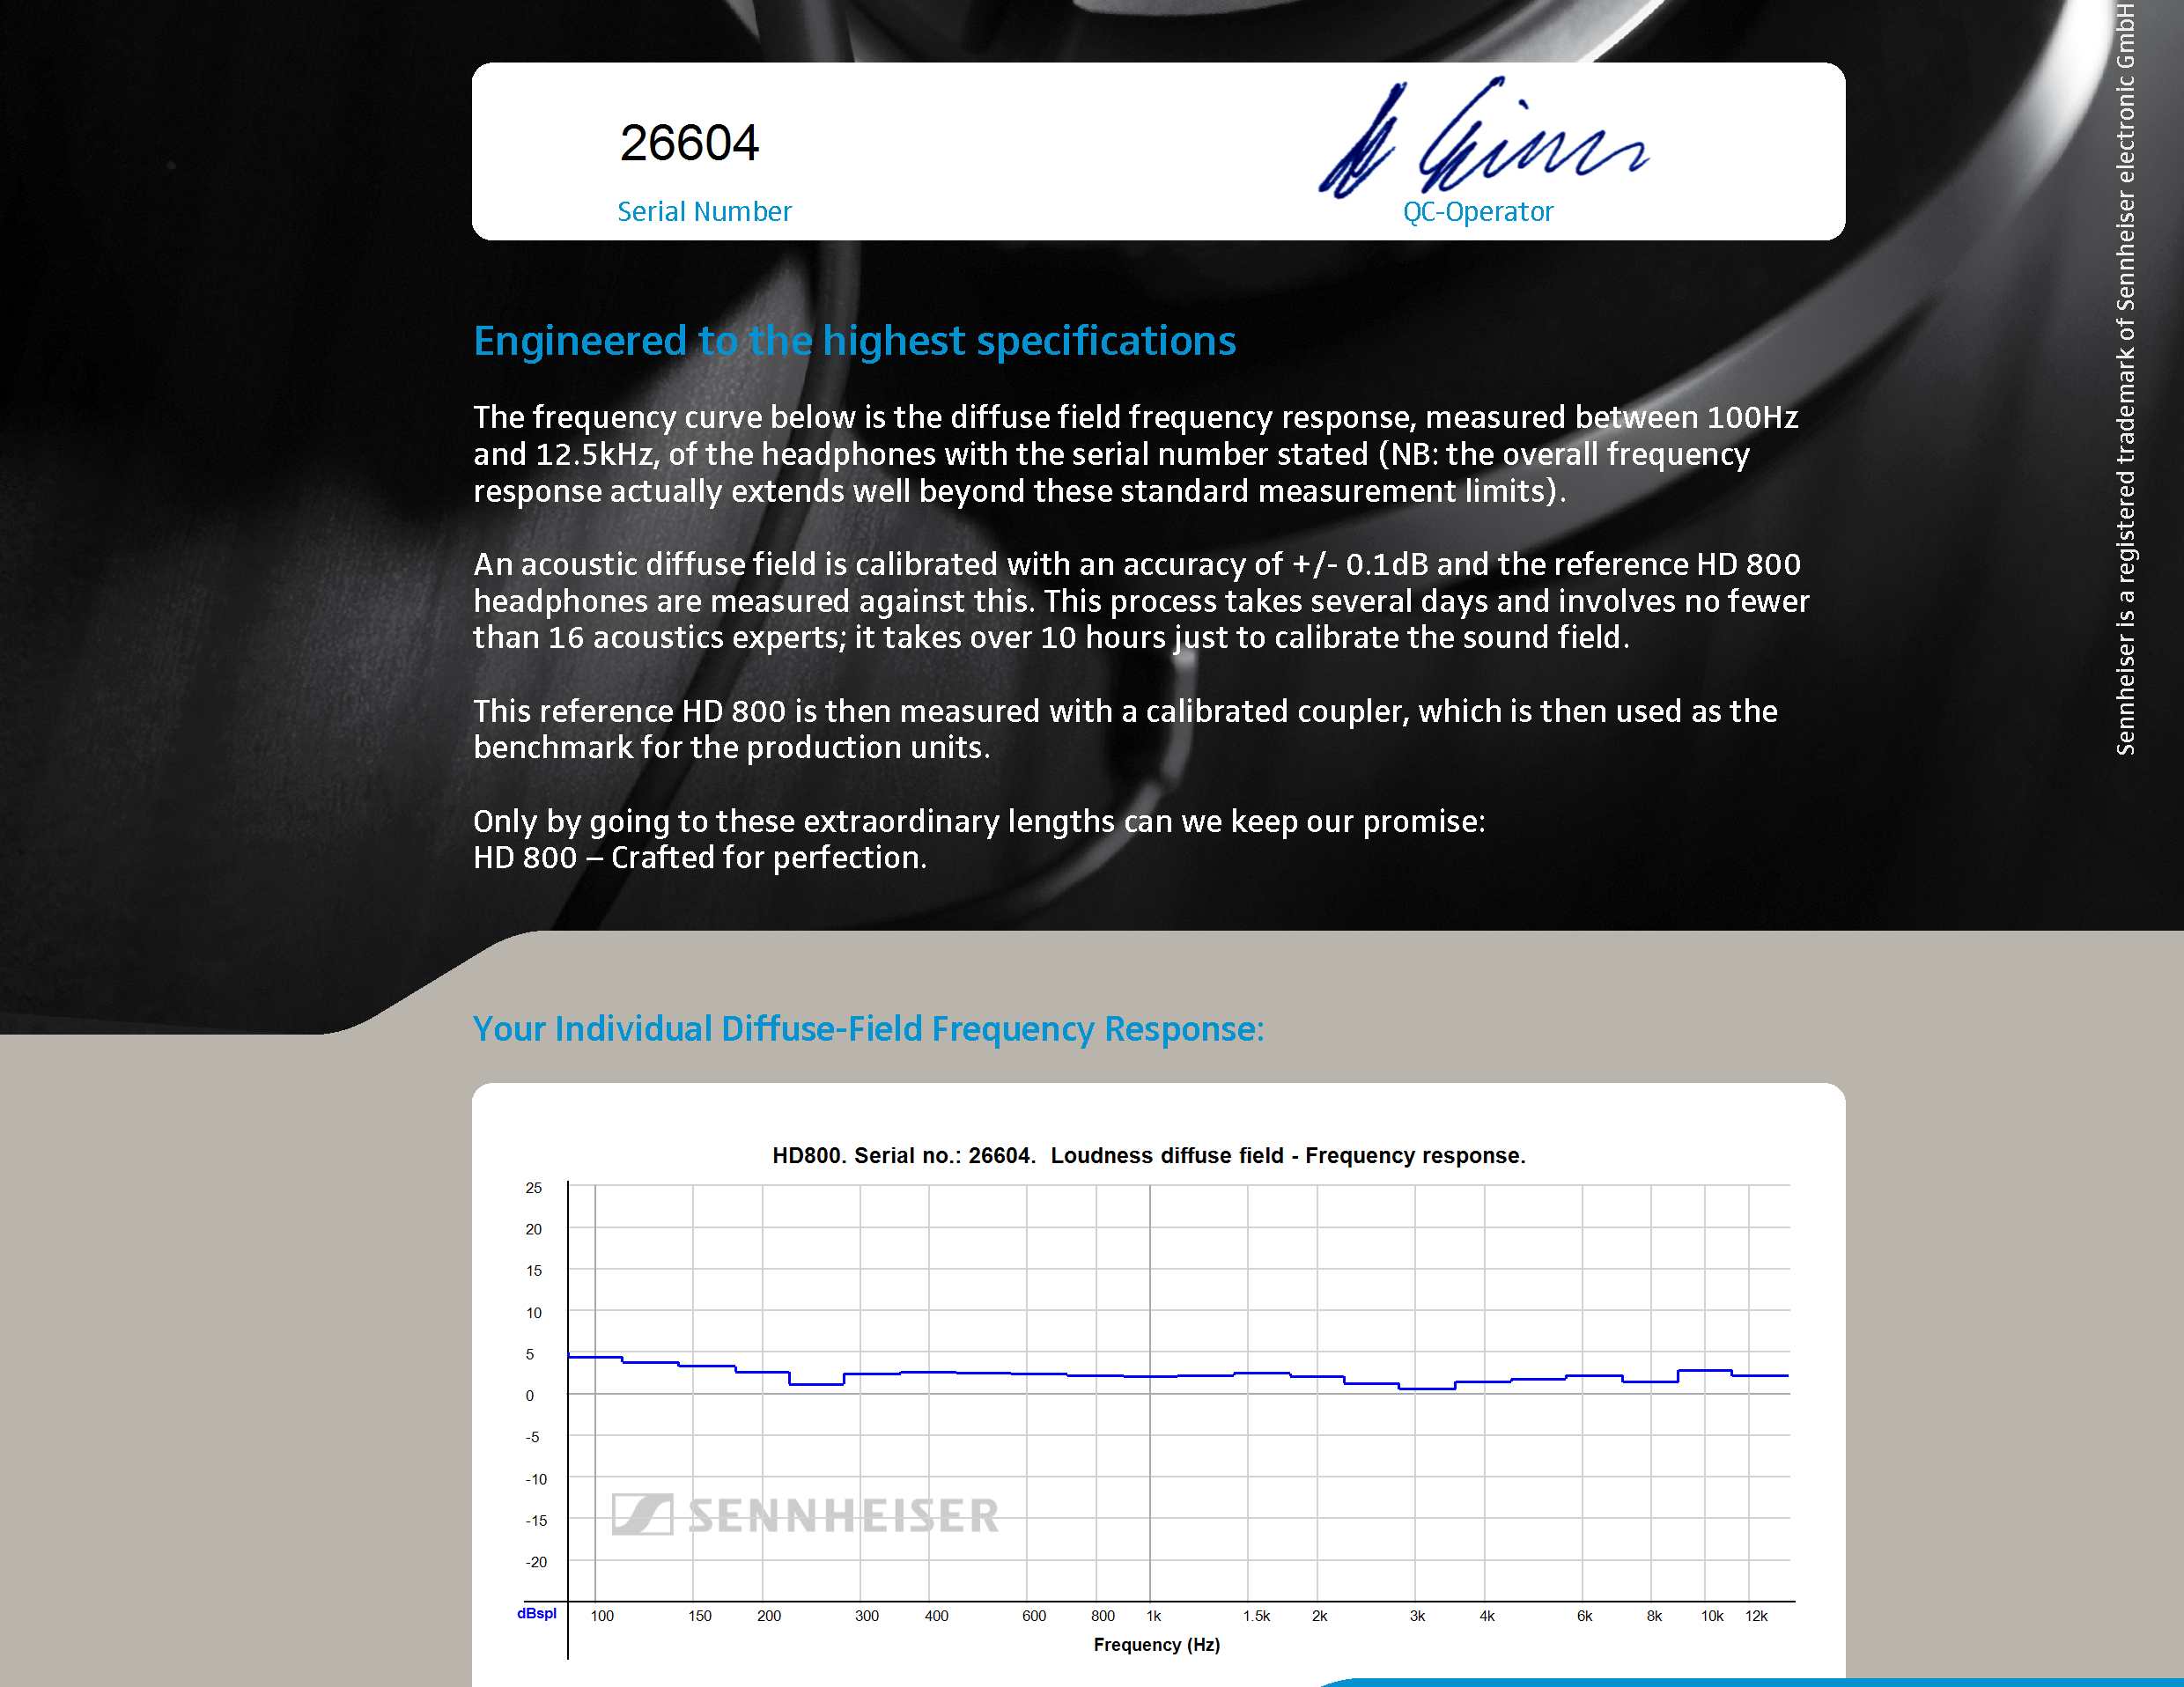
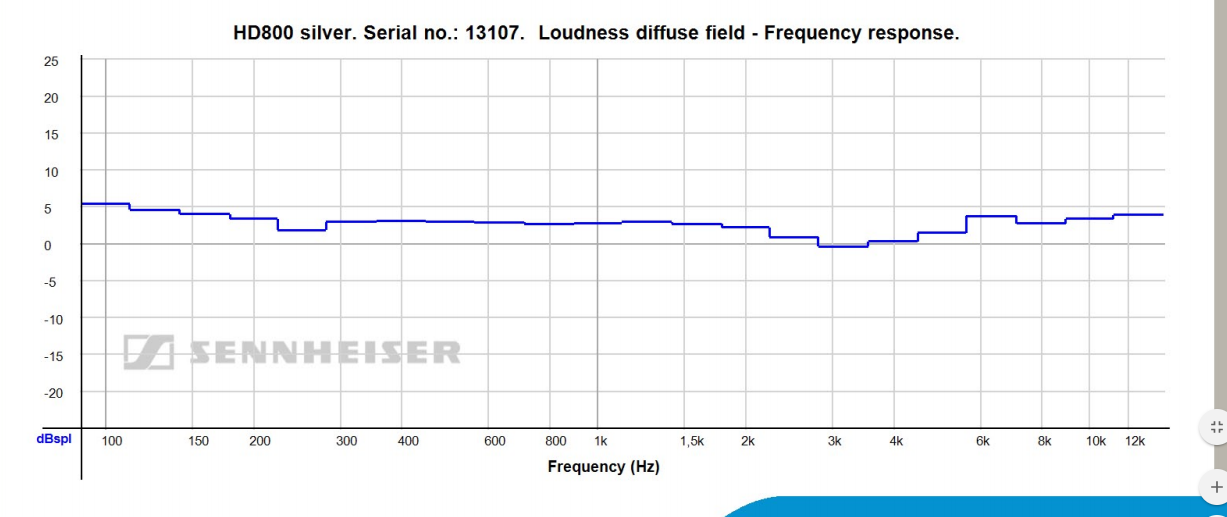
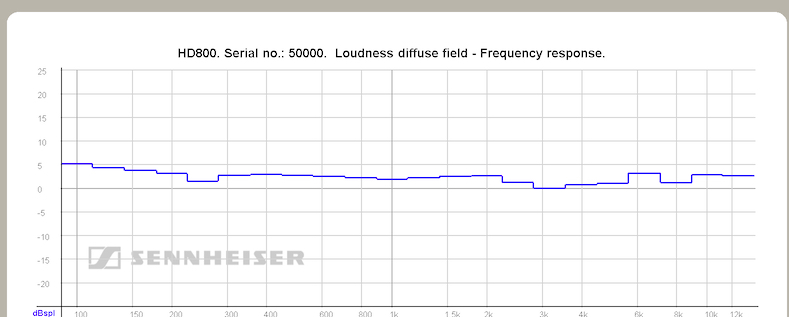
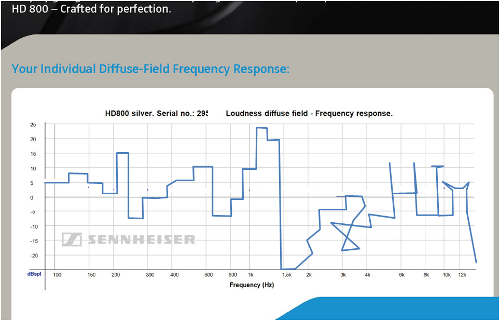
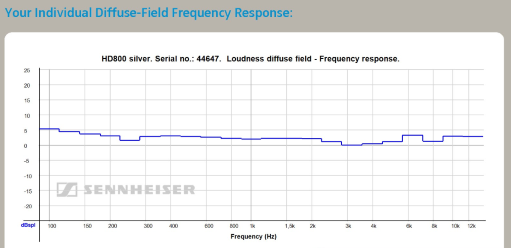
So this brings me back to my initial point: Are we looking at graphs that are matching the final sound of the HD800? I'm sure that some of the differences are not showing on a frequency response analysis (there are other important parameters that define the sounds of the phones). But from what I heard it seems that the frequency response did change over time.
It would be interesting if someone with the proper equipment could publish the graphs of a new and a 400h+ phones. Anyone interested?


")


