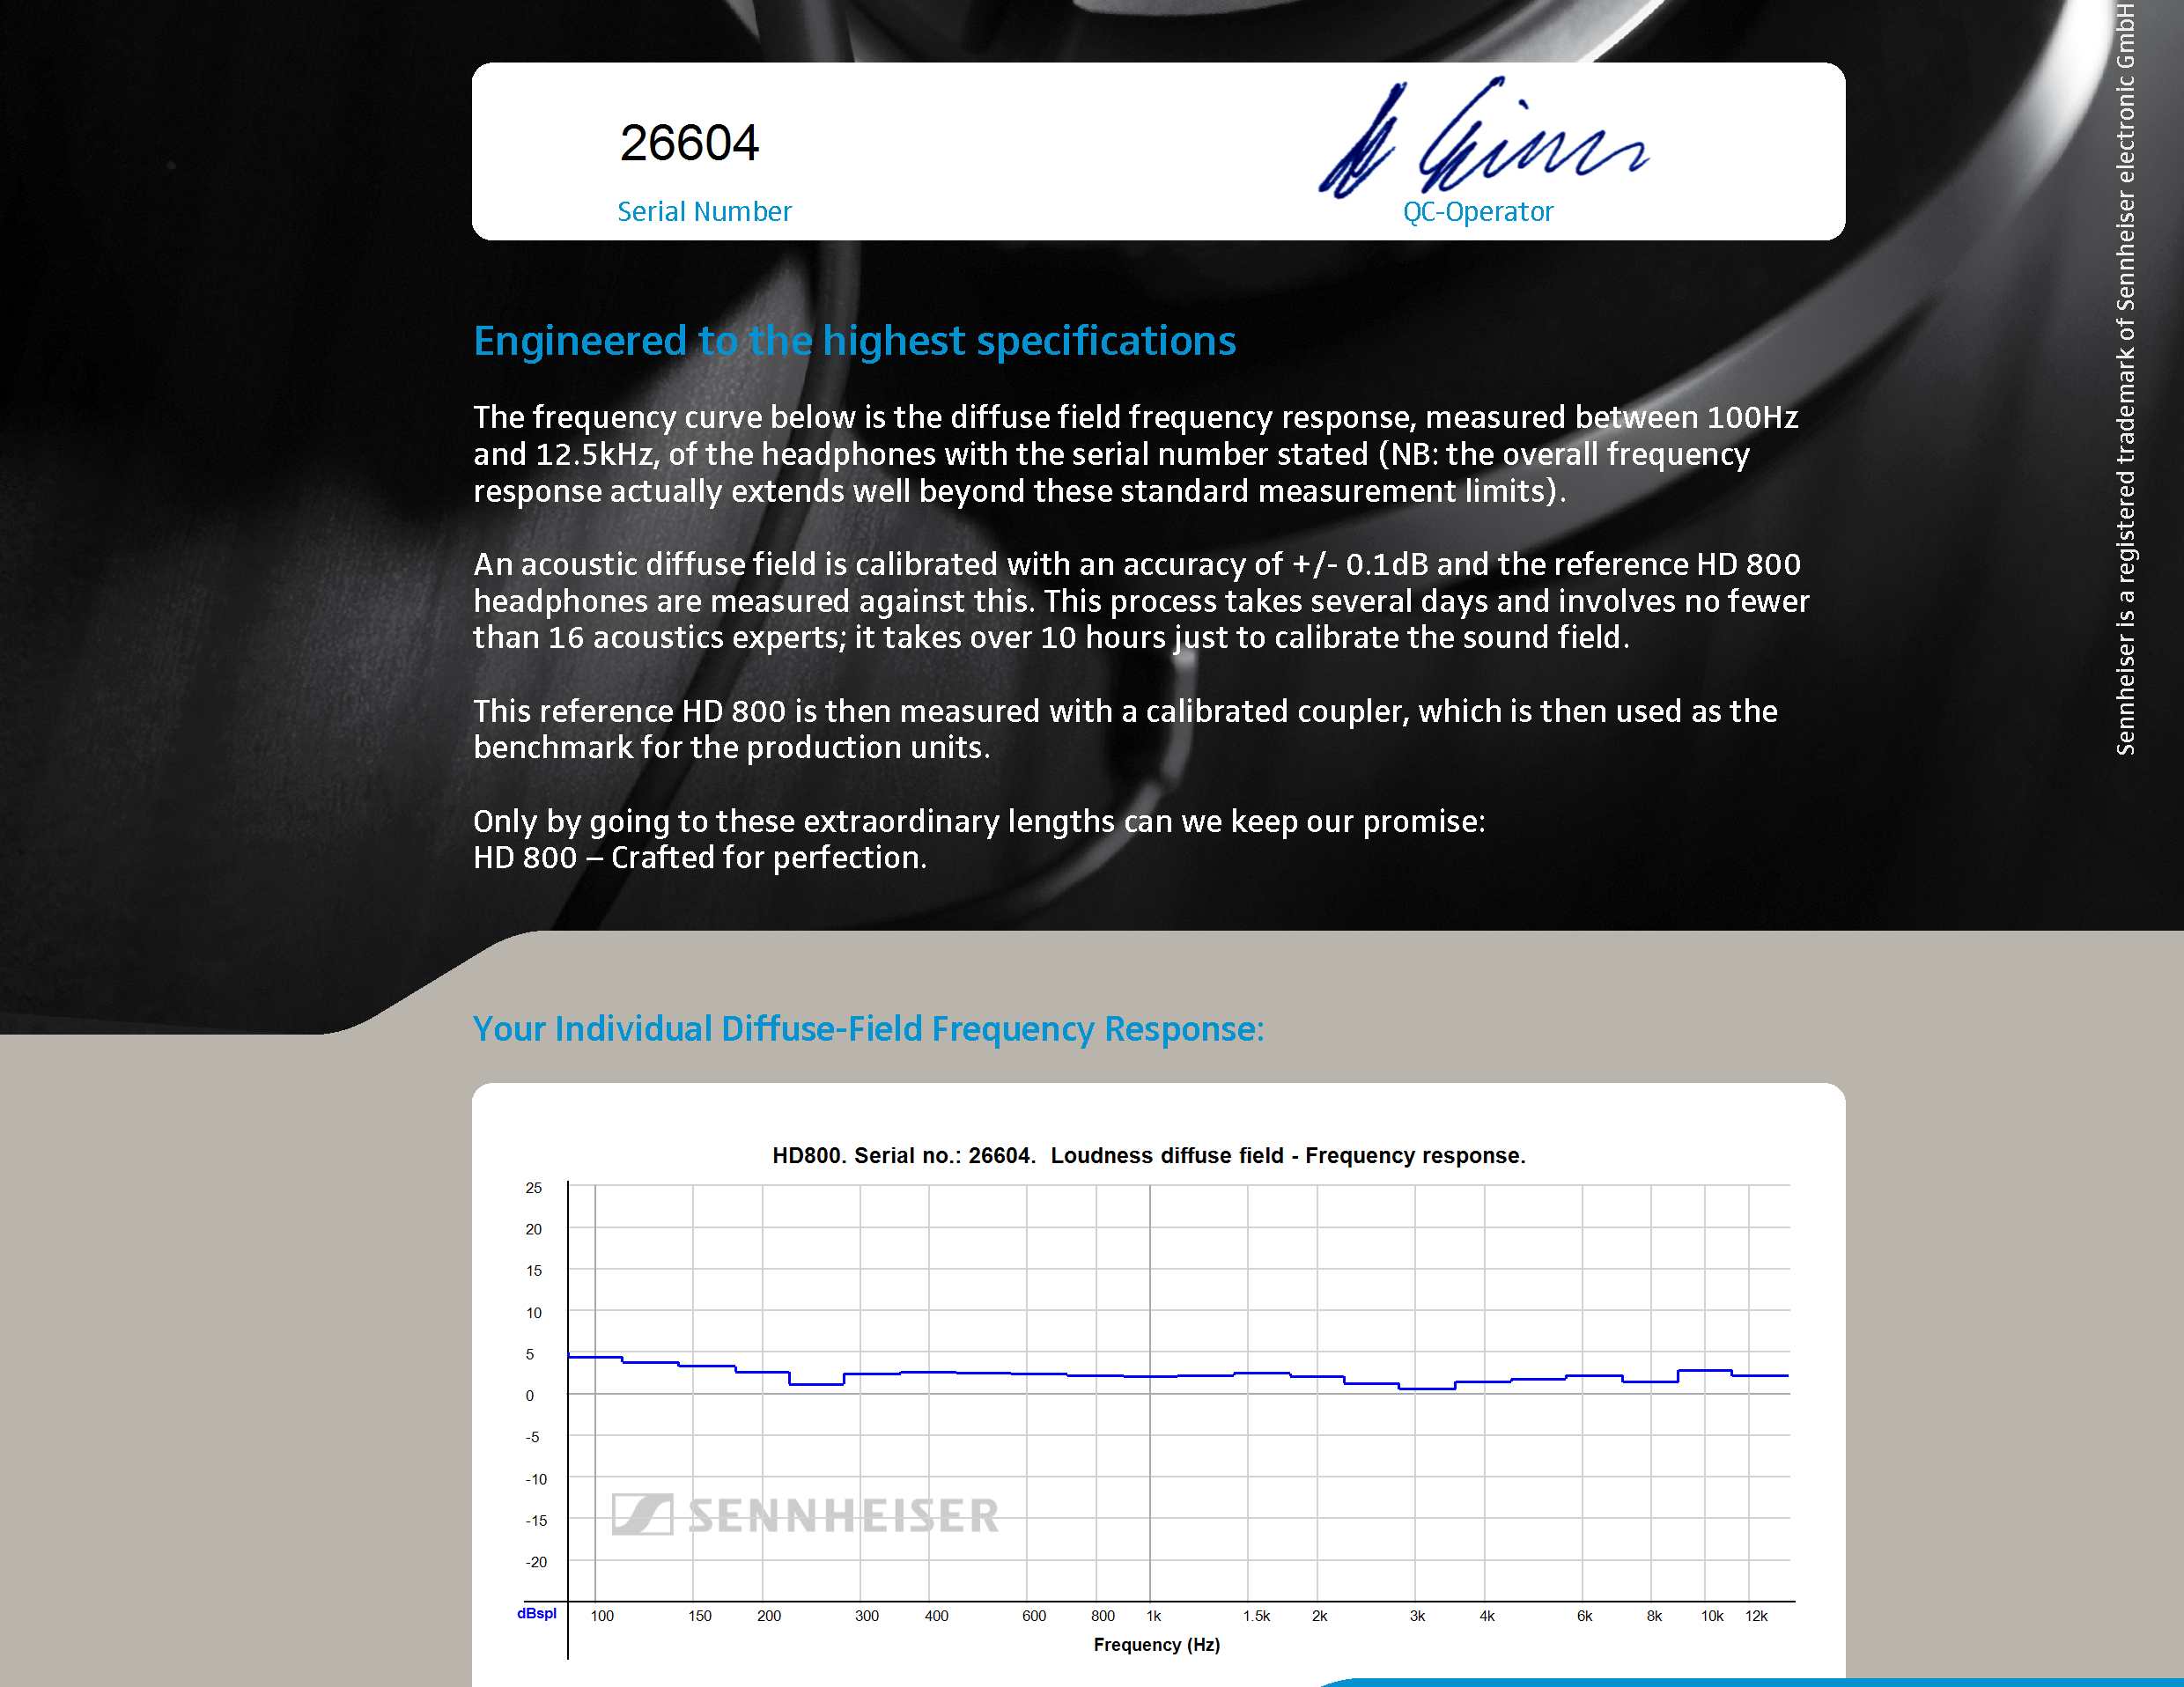
My hd800 graph, SN 6315
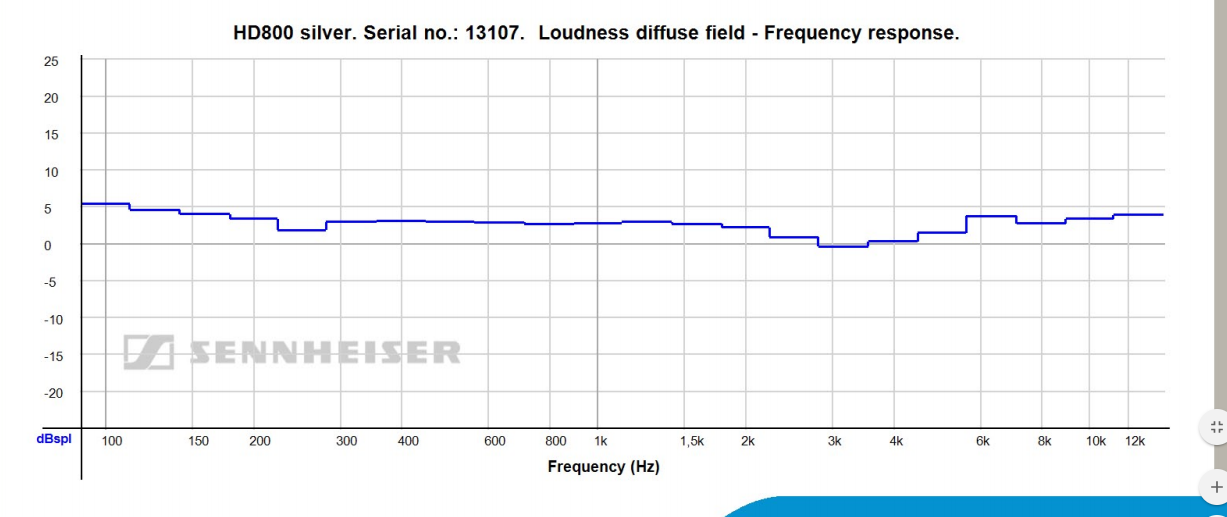
It seems that the rumor is quite true, newer hd800 has a tad deeper and a more defined bass (5db, compared to 2 - 2.5 db on the older ones), I listened one month ago a one year old hd800 and it sounded more flat and less dynamic, mine is perfectly fine, the bass is about on the same level as T1, sounds dynamic and involving, I do love both.
I still need to request for mine, but I've got the serial close to Darku's (it's in the 6000's) and I personally never thought for one second it was lacking bass either.
My hd800 graph, SN 6315
It seems that the rumor is quite true, newer hd800 has a tad deeper and a more defined bass (5db, compared to 2 - 2.5 db on the older ones), I listened one month ago a one year old hd800 and it sounded more flat and less dynamic, mine is perfectly fine, the bass is about on the same level as T1, sounds dynamic and involving, I do love both.
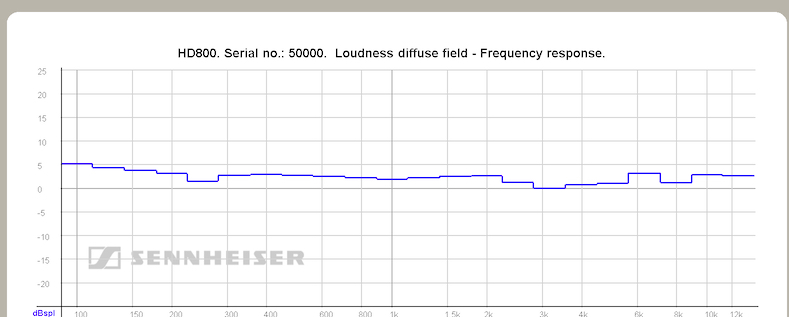
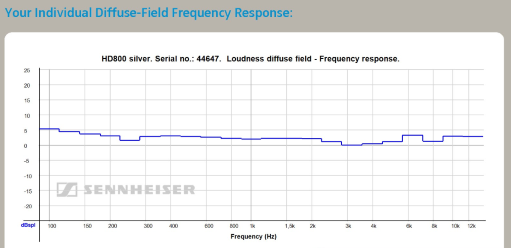
Respectable because smoothed which Sennheiser knows as well. When I report the trebles of the HD800 are uneven with sucked out middle territory, some people concur this.
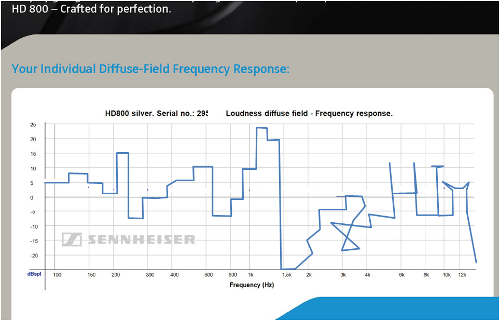
Our frequency response measurements are taken with over 500 different sample points which provides a much more detailed representation of it's sound signature.
It looks like Sennheiser is using about 22 sampling points for their graphs. Also, the range of frequencies they sample is smaller. We measure from 20 Hz to 20 kHz which ends up displaying a few more wiggles in the graph.
Jamey,
I for one, really appreciate having those measurements available for reference. You provide a super valuable resource to the Head-Fi community, not to mention a great place to buy headphone gear!!
Thanks!
We sometimes wonder how much value our measurements add but we are pretty sure that there is some value there. As for the headphones, if manufacturers keep making great products, we'll keep selling them.
x2 Appreciation for HeadRooms graphs... just showed a friend how to use them last night. Seems like a greater amount of detail is seen on the HeadRoom graphs rather than on the Sennheiser made ones.
Thank you, I am quite happy with them, find them revealing of the amps and sources driving them. Listen mostly to classical music, so neutrality is very welcome.
This site uses cookies to help personalise content, tailor your experience and to keep you logged in if you register.
By continuing to use this site, you are consenting to our use of cookies.