


luisdent
Headphoneus Supremus
- Joined
- Oct 25, 2012
- Posts
- 3,572
- Likes
- 469
Quote:
Why is that exactly? What seems off about it? And I don't see how your post relates?
Quote:
Originally Posted by gnarlsagan /img/forum/go_quote.gif
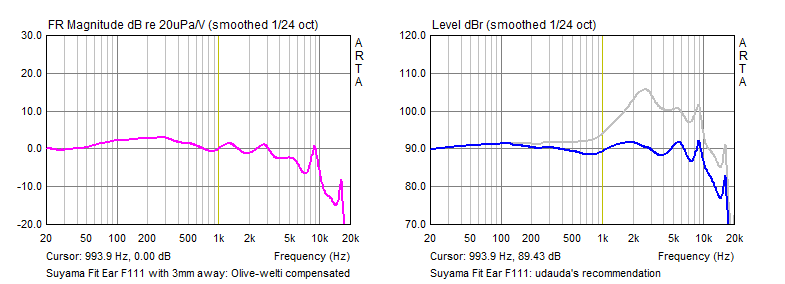
I think GE has kind of a weird standard. The treble looks too pronounced at 9k compared to Rin's graph and to my ears. And I'm not sure I agree with GE's representation of bass. Rin's is closer to how I perceive the F111. The GE graphs looks closer to Rin's Olive-Welti compensation, still kind of off though.
Interesting. The er4s bass eq i made gnarl, was based almost exclusively on the GE graph and compensating for the lack of bass according to their graph. With a little comparison with the headroom graph. You seemed to like it I think it works well.
I'm not saying I agree completely on the +6db bass compensation. However, The best bass I've ever heard in an earphone personally is the pfe112 and look at the bass on the graph. Before anyone jumps to any conclusions, I eq the two treble spikes down and the slight dip up to make it flat. But with that eq or without doesn't matter, the bass is excellent either way. Eq'ing the treble spikes down makes the bass just a tad more apparent. Unlike a lot of treble issues, the spikes here can be EQ'd to flat pretty easily. Either way though, the bass and everything up to 2khz is the best i've heard in an earphone. The etymotics have a smoother sound and better overall, but the etys with the 0-2khz of this earphone would blow minds in my opinion.

The bass isn't really even that different than the er4s if you compare them side by side. The bass just sounds flatter from sub bass to mid bass, where the ety lacks the sub bass. I think this is because we're less sensitive to low bass. The er4s stock sounds more flat from say 60hz and up, because the treble of the pfe might make the bass seem a little less overall, making the bass seem similar to the er4s. But when you eq the treble to flat, the 112 bass really shines. (still not a drastic difference) Anyhow, I really don't see why so many people have issues with the GE graphs. If it's just the bass compensation then who cares? The graph shows the compensation visually above the reference line. If you want a headphone that doesn't have extra bass go by the reference line. If it's the room compensation, I can understand preferring one method over another, but I don't think there is any scientific method to determine the exact response of everyone's ears, so they each make compromises. But here is what I like about the GE graphs... They look the way things sound.
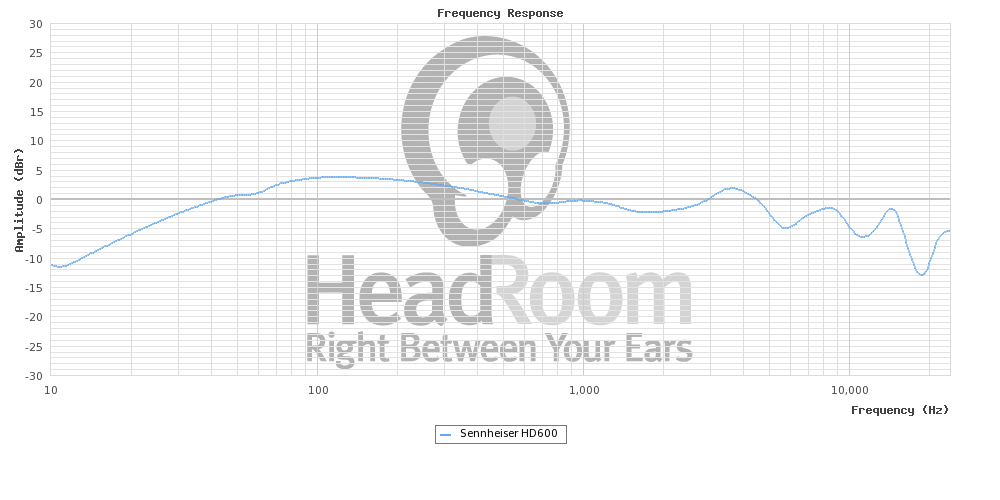
In other words, a headphone that sounds flat is essentially a flat line on the graph, again with or without the bass +6 bass. On other graphs they always tilt one way or another, have dips in the treble that you see on graph but aren't audible. I can always spot what things to expect by looking at their graphs, and I've never been surprised yet after hearing an IEM that I "guessed" what it would sound like based on the graph. They just seem to have more visual graphs. Perhaps they in fact aren't as technically correct, but I'd much rather take a slightly less technically correct graph that explains how something will sound than a more accurate technical graph that doesn't represent things in a clear way. Take the hd600 for example.


First, I'd like to add that the GE graphs look a heck of a lot like the headroom graphs. But anyway, I find the HD600 have too much mid bass and not enough sub bass. Not by a great margin, but still they do. They also have a very slight raspiness in the high treble. I try very hard to ignore the rasp, and it is slight, but it's there. I'm sure a lot of people will say I'm crazy, but when you use something like the er4s and a bunch of studio monitor speakers all the time this is easier to spot. So, looking at even the headroom graph, the bass is as I described, same on the GE graph. But take for instance the treble rasp. I would never guess there would be the slightest raspiness around 8khz based on the headroom graph (couldn't find a rin graph to compare). Even though it's slightly uneven, the treble rolls downward overall after the bass and mid areas. Now look at the GE graph. The treble is represented as being flatter. The 8-10khz is slightly raised. Not much, but then I said it wasn't a big thing to begin with, but it is there. That's exactly how the GE graph depicts it. Slight, but there. I can verify this fact by EQ'ing that area down and the rasp goes away.
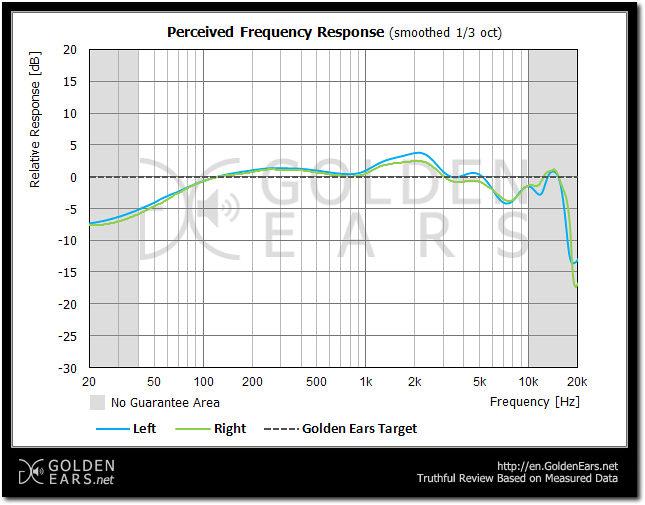
This carries over to the very large number of earphones and headphones I've tested. They all match the GE graph perfectly in the way they sound in my experience. The other graphs aren't bad at all, I'm not saying that. I'm not even saying the GE graphs are better. I'm just saying I think they are easier to make assumptions based off of and also EQ settings. Let's take a look at the venerable er4s.

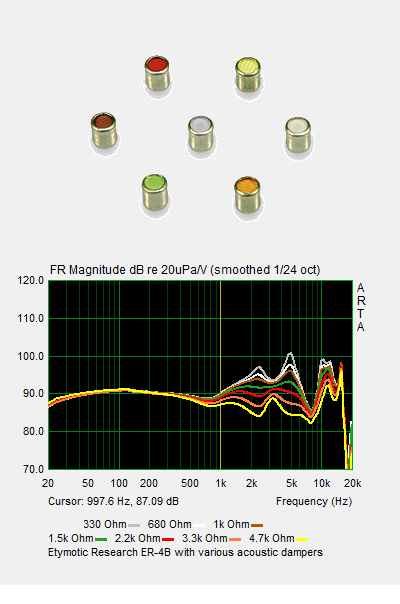
Again, very accurately represented in the way I physically hear the er4s. The sub bass is slightly lacking the most, the bass and mids are fairly level with a bit much at the 1-3khz area and a slight dip at the 7-8khz area. EQ'ing them based on this graph (what I've posted on the er4s thread) makes them sound much more like a studio monitor speaker. They aren't far off, and the bulk of what people hear easily is in the unshaded area. So if you look at just that the bass is even less lacking. But anyhow, now look at another graph. I'll use this one, because it servers two purposes:

First, this is not easy to look at and say "there is a lack of sub bass". Sure, the line curves down a bit, but it otherwise seems relatively level with the mid area. That's not the case with my listening. The sub bass is the lowest part of the whole spectrum. The bass is excellent and very flat. The treble is very flat with the bass. The only problematic area would be the same 1-3khz area the GE graph shows. But here it looks more like the entire 1-6khz area (going by the stock green tips) is raised about the level of the entire bass area up to even 1khz. Then there is a noticeable dip at 7-8khz. Sure, the 7-8khz area is slightly lacking, but this makes it look like a larger issue. As if it would be very audible. It's only very slight in real listening. Then take 10-12 or 13khz. What is that? I hear no such spike in the treble. Visually that shows that range as being almost twice as much as the 1-6khz area.
Now, realistically, I can look at this and take into account the scope and scale of the graph and extrapolate certain things. But i'd never look at any of those filter graphs and think the entire treble range would sound smooth and flat. With the GE graphs I would think there were two very small problem areas while generally being flat. So, while both graphs convey similar info, I just find the GE graph conveys it more obviously.
I say use whatever graph you are comfortable with. I personally use them all and gather data by comparing them. But I find I can always look at a GE graph and know what an earphone will generally sound like in terms of frequency. Obviously there are other factors beside frequency. I use GE strictly for frequency visualization. If you don't agree I'd love to hear specifics as to why you don't like the graphs. I'm open to any information like this. Also, specifics as to why you prefer another graph would be helpful. But I can't really see why people act like GE is the bane of the graphing world. The GE graphs are literally the graphs that led me to the er4s, which I believe is the flattest iem out there other than the sub bass. I haven't tried them all, and I didn't say it was the "best" earphone. I just said flattest in response overall that I've heard, and also seen on GE graphs.
I think you need to understand any graph and hear the earphones to see how they correspond. Than you could essentially use any graph if you have enough real hearing comparisons to understand what you're hearing. Of all the earphones I've heard, I've never heard anything that wasn't represented by the GE graph of that earphone, nor have I seen something on the graph that couldn't be heard in real usage. To me it's simply tried and tested. If I listen to 30 earphones and everyone is consistently easy to interpret and predict based on a certain graph, why "shouldn't" I use that graph?
Originally Posted by music_4321 /img/forum/go_quote.gif
^ Why is my instinctive / immediate reaction to the above post not to be convinced by the contents of it? At all.
EDIT: I guess part of that reaction may have something to do with something I posted 2.5 hrs ago in a different thread: http://www.head-fi.org/t/554628/akg-k3003-high-end-3-way-system-headphone/1320#post_9830666
Why is that exactly? What seems off about it? And I don't see how your post relates?
Quote:
Originally Posted by gnarlsagan /img/forum/go_quote.gif
I think GE has kind of a weird standard. The treble looks too pronounced at 9k compared to Rin's graph and to my ears. And I'm not sure I agree with GE's representation of bass. Rin's is closer to how I perceive the F111. The GE graphs looks closer to Rin's Olive-Welti compensation, still kind of off though.
Interesting. The er4s bass eq i made gnarl, was based almost exclusively on the GE graph and compensating for the lack of bass according to their graph. With a little comparison with the headroom graph. You seemed to like it
I think it works well.I'm not saying I agree completely on the +6db bass compensation. However, The best bass I've ever heard in an earphone personally is the pfe112 and look at the bass on the graph. Before anyone jumps to any conclusions, I eq the two treble spikes down and the slight dip up to make it flat. But with that eq or without doesn't matter, the bass is excellent either way. Eq'ing the treble spikes down makes the bass just a tad more apparent. Unlike a lot of treble issues, the spikes here can be EQ'd to flat pretty easily. Either way though, the bass and everything up to 2khz is the best i've heard in an earphone. The etymotics have a smoother sound and better overall, but the etys with the 0-2khz of this earphone would blow minds in my opinion.
The bass isn't really even that different than the er4s if you compare them side by side. The bass just sounds flatter from sub bass to mid bass, where the ety lacks the sub bass. I think this is because we're less sensitive to low bass. The er4s stock sounds more flat from say 60hz and up, because the treble of the pfe might make the bass seem a little less overall, making the bass seem similar to the er4s. But when you eq the treble to flat, the 112 bass really shines. (still not a drastic difference) Anyhow, I really don't see why so many people have issues with the GE graphs. If it's just the bass compensation then who cares? The graph shows the compensation visually above the reference line. If you want a headphone that doesn't have extra bass go by the reference line. If it's the room compensation, I can understand preferring one method over another, but I don't think there is any scientific method to determine the exact response of everyone's ears, so they each make compromises. But here is what I like about the GE graphs... They look the way things sound.
In other words, a headphone that sounds flat is essentially a flat line on the graph, again with or without the bass +6 bass. On other graphs they always tilt one way or another, have dips in the treble that you see on graph but aren't audible. I can always spot what things to expect by looking at their graphs, and I've never been surprised yet after hearing an IEM that I "guessed" what it would sound like based on the graph. They just seem to have more visual graphs. Perhaps they in fact aren't as technically correct, but I'd much rather take a slightly less technically correct graph that explains how something will sound than a more accurate technical graph that doesn't represent things in a clear way. Take the hd600 for example.
First, I'd like to add that the GE graphs look a heck of a lot like the headroom graphs. But anyway, I find the HD600 have too much mid bass and not enough sub bass. Not by a great margin, but still they do. They also have a very slight raspiness in the high treble. I try very hard to ignore the rasp, and it is slight, but it's there. I'm sure a lot of people will say I'm crazy, but when you use something like the er4s and a bunch of studio monitor speakers all the time this is easier to spot. So, looking at even the headroom graph, the bass is as I described, same on the GE graph. But take for instance the treble rasp. I would never guess there would be the slightest raspiness around 8khz based on the headroom graph (couldn't find a rin graph to compare). Even though it's slightly uneven, the treble rolls downward overall after the bass and mid areas. Now look at the GE graph. The treble is represented as being flatter. The 8-10khz is slightly raised. Not much, but then I said it wasn't a big thing to begin with, but it is there. That's exactly how the GE graph depicts it. Slight, but there. I can verify this fact by EQ'ing that area down and the rasp goes away.
This carries over to the very large number of earphones and headphones I've tested. They all match the GE graph perfectly in the way they sound in my experience. The other graphs aren't bad at all, I'm not saying that. I'm not even saying the GE graphs are better. I'm just saying I think they are easier to make assumptions based off of and also EQ settings. Let's take a look at the venerable er4s.
Again, very accurately represented in the way I physically hear the er4s. The sub bass is slightly lacking the most, the bass and mids are fairly level with a bit much at the 1-3khz area and a slight dip at the 7-8khz area. EQ'ing them based on this graph (what I've posted on the er4s thread) makes them sound much more like a studio monitor speaker. They aren't far off, and the bulk of what people hear easily is in the unshaded area. So if you look at just that the bass is even less lacking. But anyhow, now look at another graph. I'll use this one, because it servers two purposes:
First, this is not easy to look at and say "there is a lack of sub bass". Sure, the line curves down a bit, but it otherwise seems relatively level with the mid area. That's not the case with my listening. The sub bass is the lowest part of the whole spectrum. The bass is excellent and very flat. The treble is very flat with the bass. The only problematic area would be the same 1-3khz area the GE graph shows. But here it looks more like the entire 1-6khz area (going by the stock green tips) is raised about the level of the entire bass area up to even 1khz. Then there is a noticeable dip at 7-8khz. Sure, the 7-8khz area is slightly lacking, but this makes it look like a larger issue. As if it would be very audible. It's only very slight in real listening. Then take 10-12 or 13khz. What is that? I hear no such spike in the treble. Visually that shows that range as being almost twice as much as the 1-6khz area.
Now, realistically, I can look at this and take into account the scope and scale of the graph and extrapolate certain things. But i'd never look at any of those filter graphs and think the entire treble range would sound smooth and flat. With the GE graphs I would think there were two very small problem areas while generally being flat. So, while both graphs convey similar info, I just find the GE graph conveys it more obviously.
I say use whatever graph you are comfortable with. I personally use them all and gather data by comparing them. But I find I can always look at a GE graph and know what an earphone will generally sound like in terms of frequency. Obviously there are other factors beside frequency. I use GE strictly for frequency visualization. If you don't agree I'd love to hear specifics as to why you don't like the graphs. I'm open to any information like this. Also, specifics as to why you prefer another graph would be helpful. But I can't really see why people act like GE is the bane of the graphing world. The GE graphs are literally the graphs that led me to the er4s, which I believe is the flattest iem out there other than the sub bass. I haven't tried them all, and I didn't say it was the "best" earphone. I just said flattest in response overall that I've heard, and also seen on GE graphs.
I think you need to understand any graph and hear the earphones to see how they correspond. Than you could essentially use any graph if you have enough real hearing comparisons to understand what you're hearing. Of all the earphones I've heard, I've never heard anything that wasn't represented by the GE graph of that earphone, nor have I seen something on the graph that couldn't be heard in real usage. To me it's simply tried and tested. If I listen to 30 earphones and everyone is consistently easy to interpret and predict based on a certain graph, why "shouldn't" I use that graph?


")
