


- Joined
- Aug 25, 2013
- Posts
- 2,648
- Likes
- 419
I am the only one that think the Oppo looks retro and overall not so great?
Everyone is entitled to their own opinion, not all of them have to agree!
I am the only one that think the Oppo looks retro and overall not so great?

|
Make every day a fun day filled with music and friendship!
Stay updated on Dan Clark Audio at their sponsor profile on Head-Fi.


|
|
|
Make every day a fun day filled with music and friendship!
Stay updated on Dan Clark Audio at their sponsor profile on Head-Fi.
|
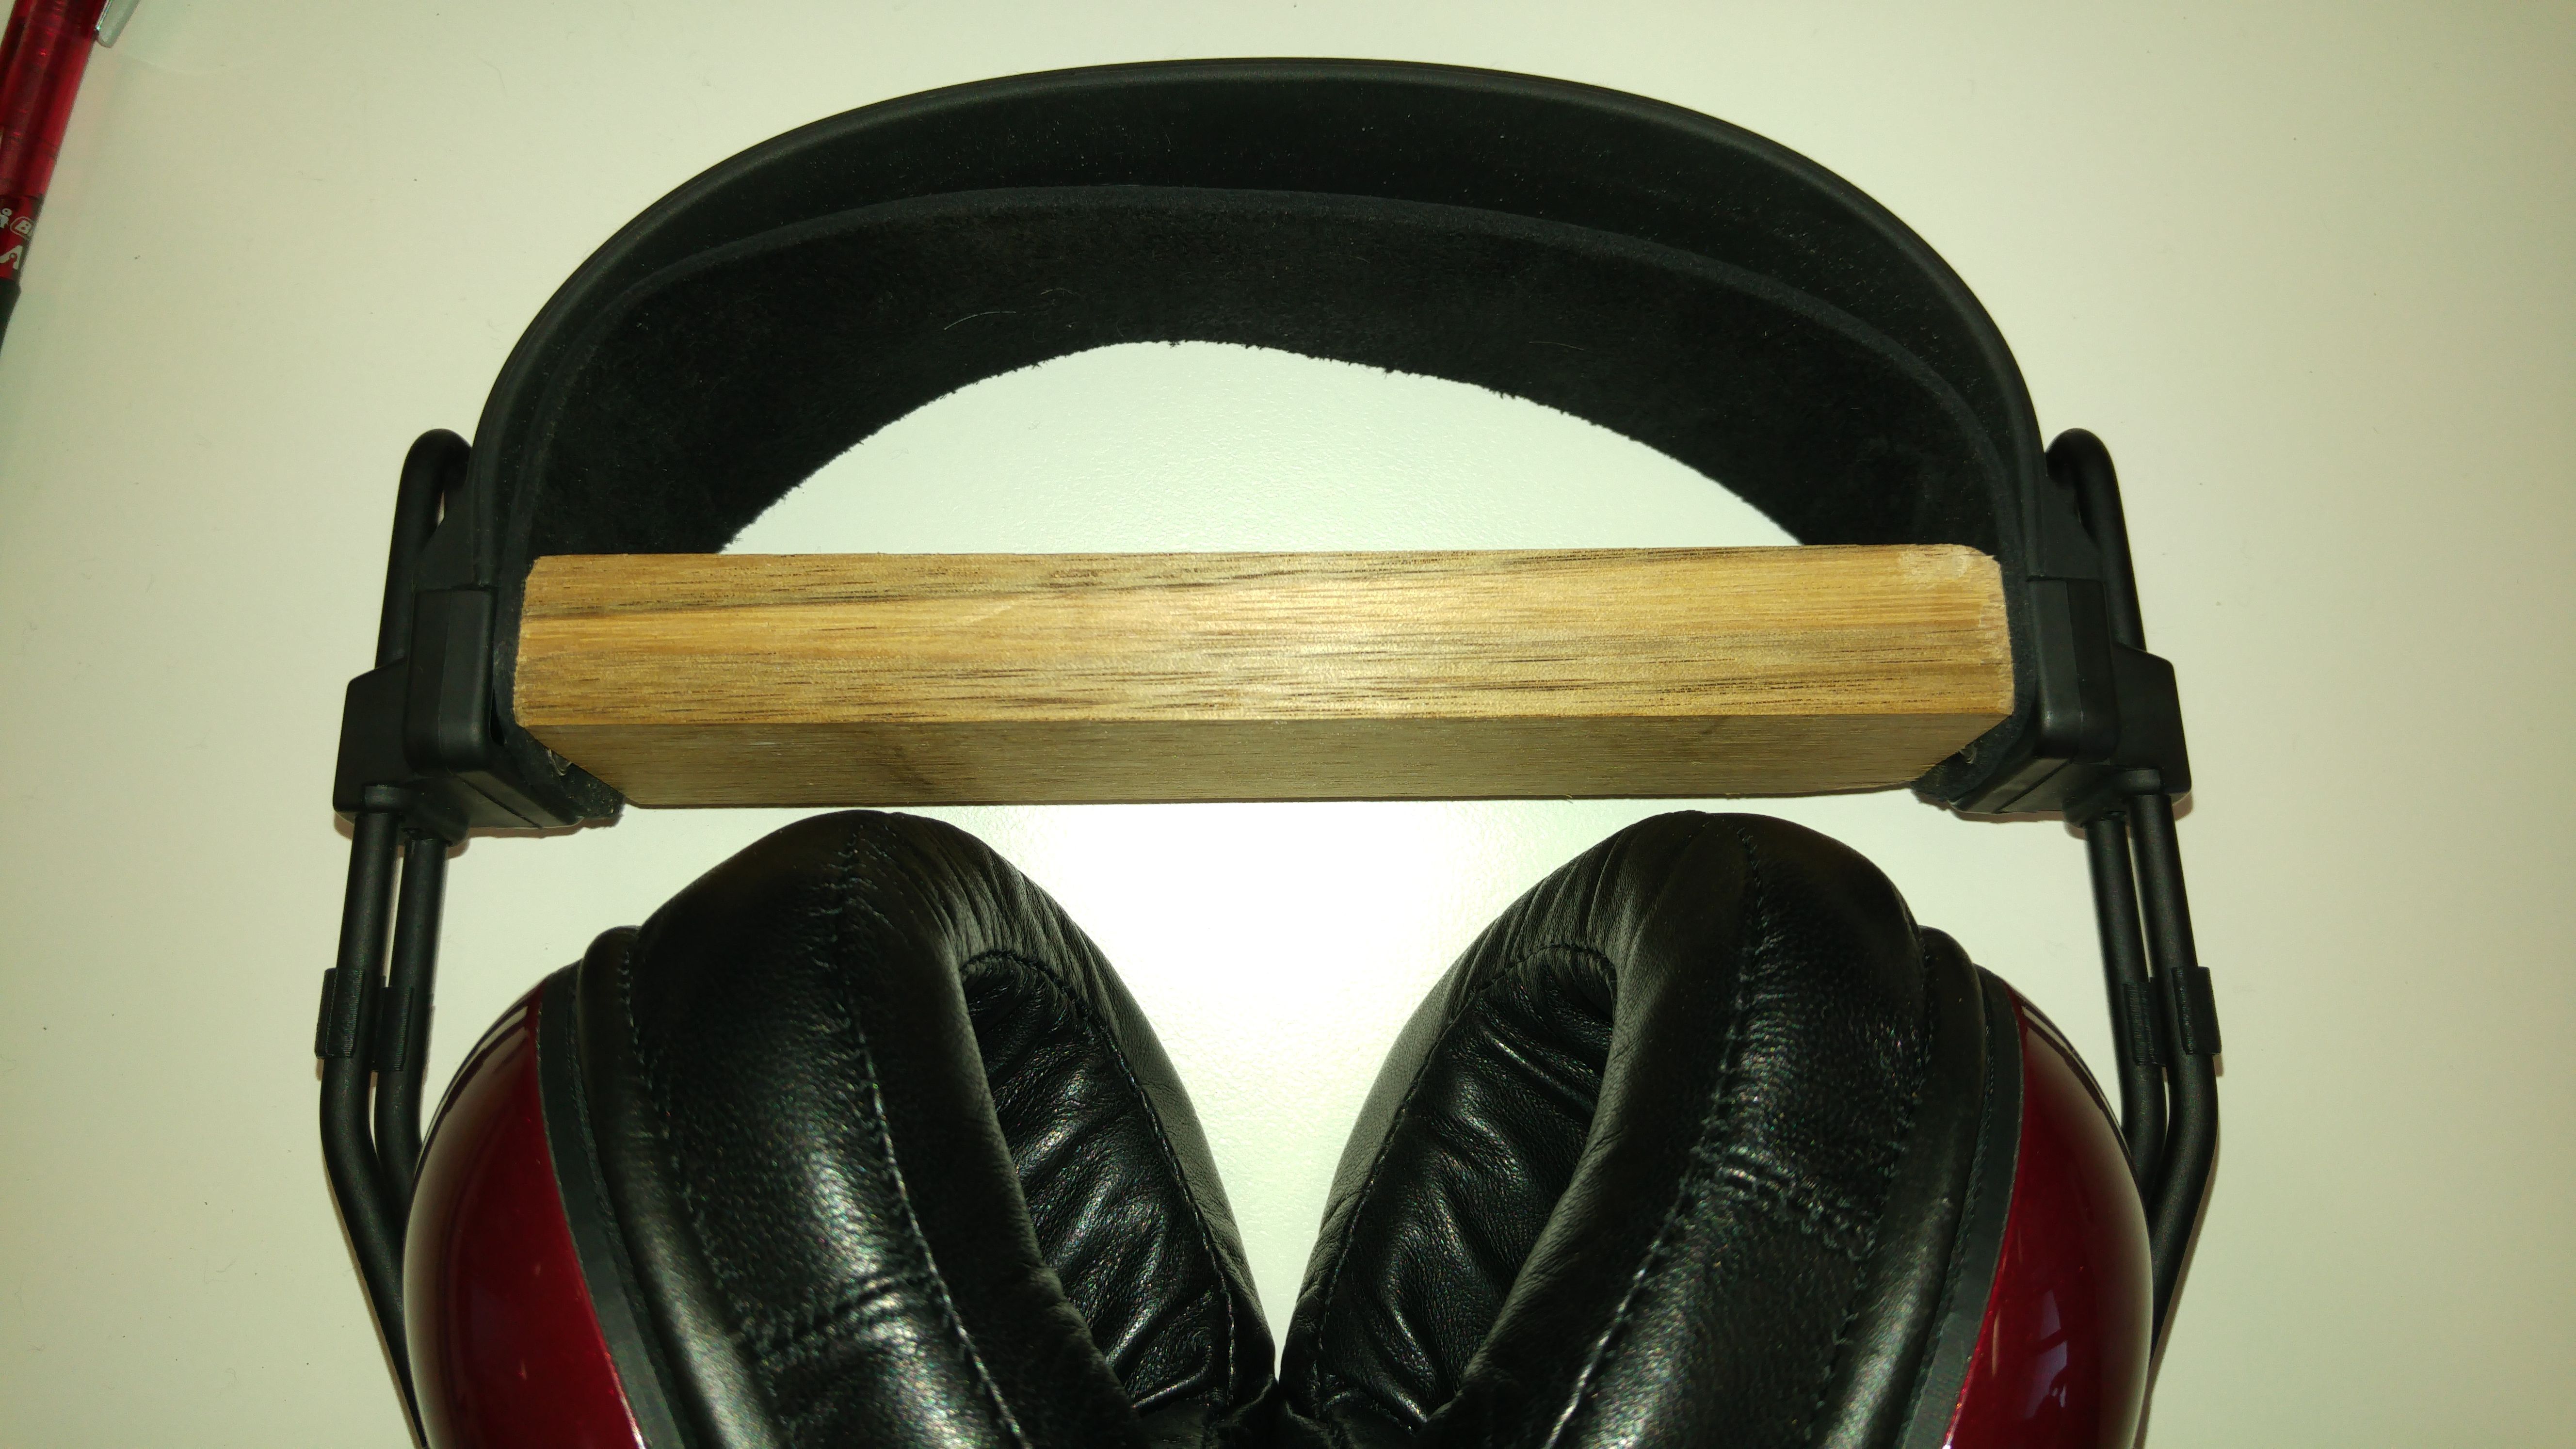
And for grins, our super-expensive headphone stand (at least today).

Might want to wait for a price on the Oppos - it's possible they will cost a lot more than Alphas.
And for grins, our super-expensive headphone stand (at least today).

Now that we're starting to catch up, here is the often requested frequency response. This is not an average, it is not smoothed, and it's a single point measurement (vs an average of multiple passes for one phone) for our master reference headphone. We tune our phones to be within +/-2dB of this curve.
As usual, the rolloff that starts at about 1.5K is characteristic of our headphone measurement system, and actually this represents linear. What's going on in the plot above 5K is very random based on micro adjustments of the phone on the test fixture.
I always hesitate to put plots out as many people expect headphone measurements to look like ruler flat speaker plots, but the reality is above 1.5K peaks and troughs are part of "flat" measurements.
That really is a great looking graph. Can't wait to get the demo pair!!!
I am the only one that think the Oppo looks retro and overall not so great?
That really is a great looking graph. Can't wait to get the demo pair!!!
Which should be coming to me very very soon, then on to you bud...............PM me your address by the way.

Now that we're starting to catch up, here is the often requested frequency response. This is not an average, it is not smoothed, and it's a single point measurement (vs an average of multiple passes for one phone) for our master reference headphone. We tune our phones to be within +/-2dB of this curve.
As usual, the rolloff that starts at about 1.5K is characteristic of our headphone measurement system, and actually this represents linear. What's going on in the plot above 5K is very random based on micro adjustments of the phone on the test fixture.
I always hesitate to put plots out as many people expect headphone measurements to look like ruler flat speaker plots, but the reality is above 1.5K peaks and troughs are part of "flat" measurements.

|
|
Make every day a fun day filled with music and friendship!
Stay updated on Dan Clark Audio at their sponsor profile on Head-Fi.
|
That is a sexy looking graph. Some reference class tuning there.


