why aren't all reviews...
Jul 6, 2012 at 10:58 PM Post #16 of 28
@Inks- Off topic slightly but since we've discussed before and you mentioned it here:
 
Stretched or not, at best this IF sba03 graph is showing a 3db bass boost (all the difference between 100 hz and 1k are between the 0 and -5 mark).  I don't understand how to interpret this as 7 db's of bass boost; if I draw a flat line from 1k to the left and one from the top of the bass at 100, it shows a difference of 2.5 db. To get from 7 db to 2.5, you'd have to not stretch the graph but physically alter it, basically rendering it useless.
 
The a161p has less bass than the W4, UM2, UM3X and, to my ears, only slightly more bass than the CK10.  To have 7db's of bass boost it would be bassier than all 3 Westone models and could be considered a bass heavy earphone.  This is not what I find in a direct comparison with those earphones and in fact find all the Westones to have considerable more bass than the A161p.
 
This in a no way an argument against graphs and measurements, when in fact I am in 100% agreement with your stance.  I just don't understand your interpretation of the sba03 graph.


Jul 6, 2012 at 11:06 PM Post #17 of 28
haha well this turned out to be an interesting thread. So while everything in an iem can be judged objectively, it is prohibitively expensive and difficult to do so, plus it takes some of the fun out of the whole ordeal.
Good to know guys! thanks for the discussion
 
Jul 6, 2012 at 11:08 PM Post #18 of 28
Quote:
@Inks- Off topic slightly but since we've discussed before and you mentioned it here:
 
Stretched or not, at best this IF sba03 graph is showing a 3db bass boost (all the difference between 100 hz and 1k are between the 0 and -5 mark).  I don't understand how to interpret this as 7 db's of bass boost; if I draw a flat line from 1k to the left and one from the top of the bass at 100, it shows a difference of 2.5 db. To get from 7 db to 2.5, you'd have to not stretch the graph but physically alter it, basically rendering it useless.
 
The a161p has less bass than the W4, UM2, UM3X and, to my ears, only slightly more bass than the CK10.  To have 7db's of bass boost it would be bassier than all 3 Westone models and could be considered a bass heavy earphone.  This is not what I find in a direct comparison with those earphones and in fact find all the Westones to have considerable more bass than the A161p.
 
This in a no way an argument against graphs and measurements, when in fact I am in 100% agreement with your stance.  I just don't understand your interpretation of the sba03 graph.


I feel this way on the A161 vs W4R as well.  The A161 have a lot less bass than the W4R. 
 
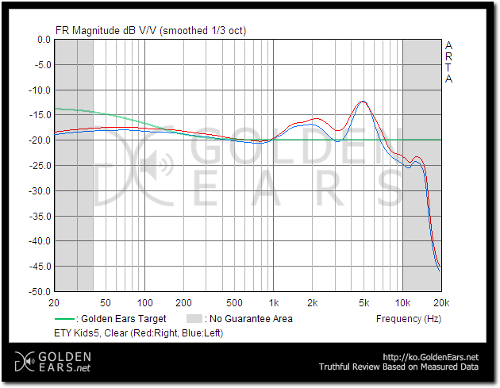
My stance on objective measurements still stands.  They should only be used to confirm subjective findings rather than creating subjective impressions.  There are some objective measurements that don't make sense when compared to each other.  The EtyKids to HFs is a prime example where the graph shows the EtyKids digging deeper withe better texture when in fact the HFs have the better texture. 
 
Jul 7, 2012 at 12:27 AM Post #19 of 28
Let's not forget that the the way the measurements are presented can also hide or emphasize certain characteristics.  Don't like that spike from 3-4.5K hz?  Just make your sample points every 2.5K Hz, and voila!  A nice smooth graph.  Look at all the FR graphs published by mfrs - do you really know how many points were measured or are included on the graph?
 
Jul 7, 2012 at 5:14 PM Post #20 of 28

@Inks- Off topic slightly but since we've discussed before and you mentioned it here:
 
Stretched or not, at best this IF sba03 graph is showing a 3db bass boost (all the difference between 100 hz and 1k are between the 0 and -5 mark).  I don't understand how to interpret this as 7 db's of bass boost; if I draw a flat line from 1k to the left and one from the top of the bass at 100, it shows a difference of 2.5 db. To get from 7 db to 2.5, you'd have to not stretch the graph but physically alter it, basically rendering it useless.
 
The a161p has less bass than the W4, UM2, UM3X and, to my ears, only slightly more bass than the CK10.  To have 7db's of bass boost it would be bassier than all 3 Westone models and could be considered a bass heavy earphone.  This is not what I find in a direct comparison with those earphones and in fact find all the Westones to have considerable more bass than the A161p.
 
This in a no way an argument against graphs and measurements, when in fact I am in 100% agreement with your stance.  I just don't understand your interpretation of the sba03 graph.
 
The A161P does have less bass than the UM3X and even the W4. I said ~5db, but it's based on Rin's measurement system where the EX1000 has a 3db boost, I have both and the A161 has noticeably more midbass and a thicker midrange as a resultBased on IF's levels, the EX1000 has a 1db boost and the A161 has a 2.5 boost, true. Either way, same results just different levels of measuring. 
 

I feel this way on the A161 vs W4R as well.  The A161 have a lot less bass than the W4R. 
It does and I'm sure that will be shown if or when Tyll measures the W4. 
 
My stance on objective measurements still stands.  They should only be used to confirm subjective findings rather than creating subjective impressions.  There are some objective measurements that don't make sense when compared to each other.  The EtyKids to HFs is a prime example where the graph shows the EtyKids digging deeper withe better texture when in fact the HFs have the better texture. 
They aren't creating subjective impressions, it's just that the scenario assumes a 2nd bend insertion seal on both. We had a PM session where everything mentioned coincided with the graphs except the midbass-subbass levels. I wouldn't make the "HF's have better texture" definitive either, I will go into this myself as I plan on getting both. 

 
Jul 7, 2012 at 7:11 PM Post #22 of 28
Im volunteering mine (I'm also revealing the modifications I mentioned to improve it's sound with graphs), but I'm working on it's review first, trying my best to finish that. 
 
Jul 7, 2012 at 7:38 PM Post #23 of 28
Quote:
Uh, are all you guys talking only about Frequency Response (FR) graphs? You realize that only shows you volume or presence of each area of the frequency domain, right? That's it, nothing more than sound signature.
 
To discern detail, which you can easily do with graphs, you have to look at square wave graphs and waterfall plots to help demonstrate "speed" and "timbre" among other things.
 
Graphs can show you everything audible about a headphone, but with two big precautions: the measuring setup needs to be perfect, which it never is and doesn't always approach; and it is much easier to get a feeling of what a headphone provides simply by listening to it, instead of taking hours, days, or weeks to fully understand what a particular graph means.

 
Finally, I was about to post this. The "FR doesn't show detail therefore objectivism is stupid" argument should be long dead by now.
Also I was under the impression that warmth was a FR phenomenon, I imagine other aspects are involved, but it should be revealed on FR graphs as well.
 
Jul 7, 2012 at 10:47 PM Post #25 of 28
Quote:
 
Finally, I was about to post this. The "FR doesn't show detail therefore objectivism is stupid" argument should be long dead by now.
Also I was under the impression that warmth was a FR phenomenon, I imagine other aspects are involved, but it should be revealed on FR graphs as well.

 
I never said any of this... IDK who did.
 
Jul 7, 2012 at 11:16 PM Post #26 of 28
Also I was under the impression that warmth was a FR phenomenon, I imagine other aspects are involved, but it should be revealed on FR graphs as well.


Warmth isn't just a FR phenomenon. Transient and decay also have their part and you will need more than a FR curve to see it.
 
Jul 8, 2012 at 7:27 AM Post #27 of 28
Quote:
Warmth isn't just a FR phenomenon. Transient and decay also have their part and you will need more than a FR curve to see it.

 
Pretty much what I said. I imagine that a warm transducer might have other differences in graphs, like a more inclined square wave, but in FR it should be evident too. Maybe a hump around 400Hz? This is all speculation by the way.
 
Jul 8, 2012 at 7:42 AM Post #28 of 28
Damping characteristic affects the bass character along with freq etc.. I think graphs are great for corroboration but I'd never buy anything based on measurements. The interactions of the diffferent aspects of a device are too complex to be certain of it's character from looking at pictures. Your ears are remarkably good instruments and can bundle all those things into an understandable whole. Of course if you're looking for a particular sound, a graph could help narrow the field a bit but when your talking varying degrees of right, it becomes much more difficult to see something than hear it. I know some don't believe in cable differences but does anyone here think they'd see a difference in the response of a TWAG or Balder cable etc. vs stock in a freq sweep like we rely on for earphones? There's certainly enough reports of sonic changes.
 

Users who are viewing this thread

Back
Top