why aren't all reviews...
Jul 6, 2012 at 10:51 AM Thread Starter Post #1 of 28

jaibot

New Head-Fier
Joined
Sep 30, 2009
Posts
3
Likes
0
Why don't all iem reviews simple include a frequency response graph, impedance, recorded sensitivity, and a subjective review of the ergonomics/ durability of the product?
That really is all that matters in a iem, right?
 
Jul 6, 2012 at 10:54 AM Post #2 of 28
Quote:
Why don't all iem reviews simple include a frequency response graph, impedance, recorded sensitivity, and a subjective review of the ergonomics/ durability of the product?
That really is all that matters in a iem, right?

Because everyone does not have the equipment to record a frequency graph :p
 
Ergonomics and comfort are as pointless as sound quality by the way you seem to think. Also a FR Graph will not explain the amount of detail and how warm of bright a IEM is, would it.
 
Jul 6, 2012 at 11:27 AM Post #3 of 28
It does show those things swim, unless one doesn't know how to approach it.

It's a matter of resources, getting an accurate measuring setup is expensive.
 
Jul 6, 2012 at 11:42 AM Post #4 of 28
Quote:
Because everyone does not have the equipment to record a frequency graph :p
 
Ergonomics and comfort are as pointless as sound quality by the way you seem to think. Also a FR Graph will not explain the amount of detail and how warm of bright a IEM is, would it.

 
An FR graph can do warmth and brightness.  Detailing and timbre are three areas that it cannot do.  There is also so much contradiction with FR graphs.  A => B...  C, D, and E also => B.  However, I've seen instances where A => F and H...  It's highly problematic in my eyes and inaccurate due to that reason (where one pattern can lead to two distinct properties, which one is it?).  I see it as this.  Subjectivity (with numbers) can confirm objectivity.  Objectivity can confirm subjectivity.  Objectivity can't confirm itself, you'll need lots of data points that show the same thing.  It's easy to get 30, 40, etc subjective views to match each other which can match a graph.  Subjective can confirm other subjective due to the fact that we can get a wide number of them that agree from different people.  Getting 30, 40, etc objective graphs becomes a pain in the butt though simply due to the price of equipment. 
 
Jul 6, 2012 at 12:10 PM Post #5 of 28
An FR graph can do warmth and brightness.  Detailing and timbre are three areas that it cannot do.  There is also so much contradiction with FR graphs.  A => B...  C, D, and E also => B.  However, I've seen instances where A => F and H...  It's highly problematic in my eyes and inaccurate due to that reason (where one pattern can lead to two distinct properties, which one is it?).  I see it as this.  Subjectivity (with numbers) can confirm objectivity.  Objectivity can confirm subjectivity.  Objectivity can't confirm itself, you'll need lots of data points that show the same thing.  It's easy to get 30, 40, etc subjective views to match each other which can match a graph.  Subjective can confirm other subjective due to the fact that we can get a wide number of them that agree from different people.  Getting 30, 40, etc objective graphs becomes a pain in the butt though simply due to the price of equipment. 


Detailing? Seriously what kind of term is that? Of course it can since it shows how much each frequency is portrayed from the source.

Can you point specific so called contradictions, those letters dont do any favors.

Do you know the difference between raw graphs and those that compensate with outdated free-field rather than truly flat to the source diffuse field? Point being one has to know what one is working with before judging amongs graphs of different sources.

What it can't show is soundstage width and height. Timbre is tricky since there's an external factor in something like the FX700/500 that can't be shown, but the biggest factor in a quality tone is its distribution of frequencies.
 
Jul 6, 2012 at 12:11 PM Post #6 of 28
Okay fair enough, it was more detail and timbre and them kind of things that i was saying it can not do. I have also seen a lot of differences in FR graphs for the same thing like you have mentioned in a way.
 
Also i only know how to use them to a certain level, i mean i know how they work and everything but get confused at the more complex stuff.
 
Also what would be th point of head-fi with out peoples opinion of sounds lol, it WOULD not work :L
 
Jul 6, 2012 at 12:23 PM Post #7 of 28
Quote:
Detailing? Seriously what kind of term is that? Of course it can since it shows how much each frequency is portrayed from the source.
Can you point specific so called contradictions, those letters dont do any favors.
Do you know the difference between raw graphs and those that compensate with outdated free-field rather than truly flat to the source diffuse field? Point being one has to know what one is working with before judging amongs graphs of different sources.
What it can't show is soundstage width and height. Timbre is tricky since there's an external factor in something like the FX700/500 that can't be shown, but the biggest factor in a quality tone is its distribution of frequencies.

 
Etymotic HF5 vs ACS T15...  Take a look at the bass response of both graphs...  Very similar looking, yet very different sounding.  They have their strengths in different areas, as with the weaknesses.  I think I've said this before too.
 
Jul 6, 2012 at 12:29 PM Post #9 of 28
Where is the T15 graph? The T15 is a lot warmer than the HF5 IME.

Detail can mean anything, an even distribution would allow no one part of a frequency/detail to be masked as much.
 
Jul 6, 2012 at 12:33 PM Post #10 of 28
Uh, are all you guys talking only about Frequency Response (FR) graphs? You realize that only shows you volume or presence of each area of the frequency domain, right? That's it, nothing more than sound signature.
 
To discern detail, which you can easily do with graphs, you have to look at square wave graphs and waterfall plots to help demonstrate "speed" and "timbre" among other things.
 
Graphs can show you everything audible about a headphone, but with two big precautions: the measuring setup needs to be perfect, which it never is and doesn't always approach; and it is much easier to get a feeling of what a headphone provides simply by listening to it, instead of taking hours, days, or weeks to fully understand what a particular graph means.
 
Jul 6, 2012 at 12:33 PM Post #11 of 28
What a first post for the OP, instant war heated debate! :D

To be fair, there are already places that do provide FR curve and other measurements (i.e. InnerFidelity, Golden Ears, Sound+Vision, etc), and try to combine objective and subjective review together. But we are just hobbyist here, so we do what we can with our ears and experience. If our subjective listening match those measurements, then all the better. If most of us find ourselves disagree with measurement, then obviously there must be something we have missed and worth looking into. All and all, I'll call that a win-win situation. Won't be much of a hobby if everyone just stare at graphs all days and say things like 'wow, this FR curve is amazing', 'the 250Hz should have been 3dB higher', 'I am 95% confidence that I'll love that FR" or 'I have listened to it yesterday but I am not sure it is good or not till I see the FR curve' - Yeah. :wink:
 
Jul 6, 2012 at 12:37 PM Post #12 of 28
Quote:
Where is the T15 graph? The T15 is a lot warmer than the HF5 IME.

 
It is...  The T15 graph was taken off the back of the box.  You'd have to buy the headphones to see it. 
 
Let's use a different example:


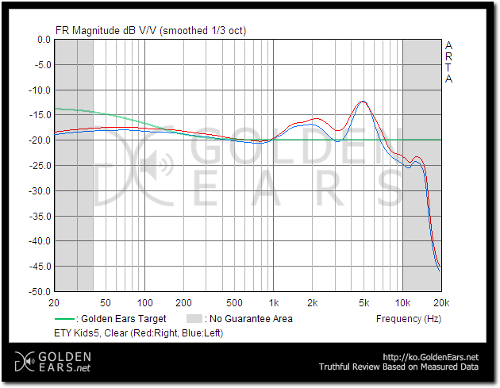
Etymotic EtyKids vs Etymotic HF...  Graphs shown above.  Now, I have a few questions:
  1. Which one is warmer, use objective evidence to support your claim.
  2. Which one will provide better sub-bass response (texturing)?  Use objective Evidence to support your claim.
  3. Which one will provide a larger bass body?  Use objective evidence to support your claim.
  4. Which one will have a bigger vocal resonance?  Use objective evidence to support your claim.
  5. Which one will have more energetic highs?  Use objective evidence to support your claim.
 
Jul 6, 2012 at 12:38 PM Post #13 of 28
Quote:
What a first post for the OP, instant war heated debate!
biggrin.gif

To be fair, there are already places that do provide FR curve and other measurements (i.e. InnerFidelity, Golden Ears, Sound+Vision, etc), and try to combine objective and subjective review together. But we are just hobbyist here, so we do what we can with our ears and experience. If our subjective listening match those measurements, then all the better. If most of us find ourselves disagree with measurement, then obviously there must be something we have missed and worth looking into. All and all, I'll call that a win-win situation. Won't be much of a hobby if everyone just stare at graphs all days and say things like 'wow, this FR curve is amazing', 'the 250Hz should have been 3dB higher', 'I am 95% confidence that I'll love that FR" or 'I have listened to it yesterday but I am not sure it is good or not till I see the FR curve' - Yeah.
wink.gif

This is what i was trying to get across kudos ClieOS.
 
Oh and i loved this:
'I have listened to it yesterday but I am not sure it is good or not till I see the FR curve'
 
hahaha!!!
 
Jul 6, 2012 at 1:16 PM Post #14 of 28
Quote:
 
It is...  The T15 graph was taken off the back of the box.  You'd have to buy the headphones to see it. 
 
Let's use a different example:
 
It'd be silly to take that graph in the box and compare it to a GE graph or IF, who knows if they used a raw method, diffuse-field or free-field or a hybrid. Even then, they can stretch out and make it look flatter. Take the A161P graph for example, it looks flat on the Meelec box when it's actually more of a 5-6db bass boost, they obviously stretched out to make it look better (it's actually the IF graph of the SBA03, IF graphs make 5dbs bass boosts look like 1db by the way they are stretched). 


Etymotic EtyKids vs Etymotic HF...  Graphs shown above.  Now, I have a few questions:
  1. Which one is warmer, use objective evidence to support your claim.
  2. Which one will provide better sub-bass response (texturing)?  Use objective Evidence to support your claim.
  3. Which one will provide a larger bass body?  Use objective evidence to support your claim.
  4. Which one will have a bigger vocal resonance?  Use objective evidence to support your claim.
  5. Which one will have more energetic highs?  Use objective evidence to support your claim.
 
First off I don't like GE graphs, because of this. Luckily their newest graphs actually show raw-data, a great step up from them. 
Still, they wouldn't be that far off in the bass regions (it's trickier with the treble, if one understand the linked article). The objective data is obviously these graphs. 
 
Take an equalizer and boost 150-250hz, that's warmth. It's a very close call but the HF5s have a tiny bit more. 
 
Sub-bass is 100hz and lower, EtyKids has more. 
 
Bass body, usually means the whole mass, when an instruments makes use of both midbass and subbass. EtyKids obviously has more bass body overall, 20hz-250hz. 
 
Vocal resonance? Can you use a more specific term? Presence and recognition is from 2k to 4k, but take the fact that GE graphs may have skewed results due to their compensations. Etykids
 
Treble energy? EtyKids has more treble but it roll-offs a bit earlier. 
 
If you want a better graph, udauda (Arthur Rin Choi) from that blog will have to graph those, I may send him those two in the future. 
 
I'm off as I need to continue my reviews...

 
Jul 6, 2012 at 3:37 PM Post #15 of 28
Uh, are all you guys talking only about Frequency Response (FR) graphs? You realize that only shows you volume or presence of each area of the frequency domain, right? That's it, nothing more than sound signature.

To discern detail, which you can easily do with graphs, you have to look at square wave graphs and waterfall plots to help demonstrate "speed" and "timbre" among other things.

Graphs can show you everything audible about a headphone, but with two big precautions: the measuring setup needs to be perfect, which it never is and doesn't always approach; and it is much easier to get a feeling of what a headphone provides simply by listening to it, instead of taking hours, days, or weeks to fully understand what a particular graph means.


What he said ^^
 

Users who are viewing this thread

Back
Top