Frequency fatigue 1 to 4.5kz. Remedy?(move thread to appropriate sub)
Mar 1, 2021 at 1:36 PM Post #91 of 103
That's actually a very nice catch, let us know what the change did for you.

It is hard for me to tell which pieces of the puzzle are making the biggest difference at this point. But I think all the above changes are making an improvement, including both the higher sample rate and bit-depth, and the EQ adjustments. And the combined effect actually seems to be quite dramatic!

To be on the safe side, I first uninstalled my EQ software. Then made sure the bit depth and sample rate were correctly set on my audio device, to 24-bit, 48 kHz. This is the highest rate supported by my TV via HDMI at the moment. Then I also applied some new changes to the EQ curve for my Beyer DT-770's... And with all the above in place, there seems to be a fairly dramatic improvement in their sound quality.

This is probably an exaggeration. But it almost seems like I was given a new pair of higher resolution ears. :) Some of the tracks that I've been using for my listening tests are the ones I recently posted here btw...

https://www.head-fi.org/threads/popular-music-of-turkey-the-caucasus-central-asia.883699/

I think there are probably still some more improvements that can be made to the tonal balance on my EQ curve. But I'm really pleased with how things have gone so far! Getting to this point has been an almost Herculean effort. And I probably could not have done it without the generous guidance and assistance of a number of members on this forum. And can't thank these folks enough for the help they've given. Hopefully, I can pay some more of it back by continuing to share what knowledge and info I've also gained from this process.

I think I now know a little better what people mean by "instrument separation", "layering" and "transparency". And think the sound stage on my DT-770's may have improved a bit as well, and gotten a bit wider and deeper. Not sure if that is due to the changes in the audio settings or the EQ correction though. (Though I suppose it could be a little of both.)
 
Last edited:
Mar 1, 2021 at 2:15 PM Post #92 of 103
What you're calling "Basic EQ" sucks. That is what people use to do bass boosts to make cheap headphones sound better and crude shifts with names of kinds of music on them. That isn't what is meant by equalization. Equalization is calibrating the response using a quarter octave graphic equalizer or a fully adjustable multi band parametric. The equalizer built into iTunes isn't a proper equalizer.

Fwiw, this is approximately what a "basic" EQ curve looks like to me... :)

EQCURVE.jpg


Still needs some more smoothing out in the bass. I've been focusing most of my attention on the treble though lately.

And this is approximately what the raw response of my DT-770's looks like after the above correction has been applied...

DT770RAW.jpg


I've left certain features intact in both the treble and bass. And have even added a few bumps and dips here and there where there were none before. I have not gotten them all tweaked quite right yet. But, for the most part, all of those bumps and dips in the raw response curve are intentional. And probably need to be there, in some form, to yield something close to the correct sound. I think they probably still need a little more improvement though.

The bump in the upper bass, for example, probably still needs a little more smoothing and correction. Imo though, that bump and the two dips on either side are most likely the result of the pads bouncing on the measurement rig. Which is probably not something I'd hear in normal listening. So imo, it probably isn't necessary to smooth that completely over on the raw plot... provided the overall balance is more or less correct in that area. I am performing a partial correction for that bump already via the dip between 100 and 200 Hz in the EQ curve above. (But It could still need a bit more, based on the response on the raw plot.)
 
Last edited:
Mar 1, 2021 at 2:21 PM Post #93 of 103
Fwiw, this is approximately what a "basic" EQ curve looks like to me... :)

EQCURVE.jpg

Still needs some more smoothing out in the bass. I've been focusing most of my attention on the treble though lately.

And this is approximately what the raw response of my DT-770's looks like after the above correction has been applied...

DT770RAW.jpg

I've left certain features intact in both the treble and bass. And have even added a few bumps and dips here and there where there were none before. I have not gotten them all tweaked quite right yet. But, for the most part, all of those bumps and dips in the curve are intentional. And probably need to be there, in some form, to yield the approximately correct sound. I think they probably still need a little more improvement though.

The bump in the upper bass, for example, probably still needs a little more smoothing and correction. Imo though, that bump and the two dips on either side are most likely the result of the pads bouncing on the measurement rig. Which is probably not something I'd hear in normal listening. So imo, it is not necessarily something which should be completely corrected away... provided the overall balance is more or less correct in that area. I am performing a partial correction for that bump already via the dip between 100 and 200 Hz in the EQ curve above. But It may still need a bit more, based on the response on the raw plot.
Very nice edit!
 
Mar 1, 2021 at 2:45 PM Post #94 of 103
Very nice edit!

Thank you sir! For the record, here is what the raw response looked like versus the Harman target on Oratory's graph, before the EQ correction was applied...

RAWAORADT770.jpg


I used the average of the two DT-770 curves above for my corrected raw plot. The sound still needs a bit more tweaking. But is already significantly improved in a number of ways.
 
Last edited:
Mar 1, 2021 at 2:50 PM Post #95 of 103
Thank you sir! For the record here is what the raw response looked like before the EQ correction on Oratory's graph...


I used the average of the two curves above for my corrected raw plot. The sound still a bit more tweaking. But is already significantly improved in a number of ways.
That upper mid spike would kill me!
I
Thank you sir! For the record here is what the raw response looked like versus the Harman target on Oratory's graph, before the EQ correction was applied...

RAWAORADT770.jpg

I used the average of the two curves above for my corrected raw plot. The sound still needs a bit more tweaking. But is already significantly improved in a number of ways.
That's awesome.

I like my signature more like this
RAWAORADT770.jpg


LOL!
But it looks more violent then when I actually make it happen.
To me fatigue is presented into punchy piercing transients in the upper mids. I enjoy thr snakes and sparkles, but not hihat slamming and out of control snares.
Some artists makes snares so pleasant, I shut off all dap.
 
Mar 1, 2021 at 3:13 PM Post #96 of 103
That upper mid spike would kill me!
I

That's awesome.

I like my signature more like this


LOL!
But it looks more violent then when I actually make it happen.
To me fatigue is presented into punchy piercing transients in the upper mids. I enjoy thr snakes and sparkles, but not hihat slamming and out of control snares.
Some artists makes snares so pleasant, I shut off all dap.

Fwiw, that yellow curve looks a bit more like a compensated diffuse field plot, rather than a raw plot, InstantSilence.

When comparing frequency response curves, you need to be sure that you're comparing apples to apples. So here is approximately what the frequency response on my DT-770's looks like, both before an after correction, with diffuse field compensation...

BEFORE EQ CORRECTION:

DIFFUSEORADT770.jpg


AFTER EQ CORRECTION:

DT770DIFFUSE.jpg
 
Last edited:
Mar 1, 2021 at 3:21 PM Post #98 of 103
I just drew that line with a phone for play and loose reference lol

Right on. :)

Fwiw, here are my target response curves, both with and without the diffuse field compensation. Both still need a bit more tweaking imho...

DIFFUSE FIELD:

DIFFUSETARGET.jpg


RAW (WITH NO COMPENSATION):

RAWTARGET.jpg


The main effect that the diffuse field compensation has is to remove that rather large ear resonance in the upper mids at about 3.5 kHz.

But you probably already knew that, didn't you. :deadhorse: :beerchug:

After that peak is removed, I think the target should probably look somewhat similar to a good loudspeaker's steady-state/sound power/in-room response curve.
 
Last edited:
Mar 1, 2021 at 6:25 PM Post #99 of 103
Yes that does make sense but some of your posts made me think you specifically worried about the EQ causing aliasing and not about the sample rate conversion causing aliasing.

I'm sorry about the confusion on that. In terms of EQ, I was really more concerned about the bit depth setting. And resampling errors from not using enough bits, since I was previously using the 16-bit 44.1 kHz mode on my audio device.

My concerns re the differences in the 44.1 vs. 48 kHz sampling rates were of a more general nature, as you describe. Because I didn't want there to be any unnecessary conversion going on between the two rates in my system. It looks like that's been fixed though by switching my audio device setting to the higher rate.

Ideally the DAC should be set to the same sample rate that it receives on its input, otherwise it is forced to do a sample rate conversion which can indeed cause some aliasing.

That was my thought as well. Especially, for a cheap DAC like mine. The less work it has to do to accurately reproduce the sound, the better. I think it's probably less lossy though if you're increasing the sample rate to a much higher frequency. Maybe that's wrong though.

personally didn't have the misfortune of hearing the artifacts of improper sample rate conversion. Maybe the DACs I used could handle the conversion well, or maybe it couldn't handle it well but my hearing just isn't good enough to pick up on it. I can't know for sure.

My hearing isn't great either. Some of the "roughness" in sound that I was experiencing before seems to be gone though after switching from 16-bit 44.1 kHz to 24-bit 48 kHz. So I think there probably is some advantage in getting both the sample rates and bit depths better set for your particular applications.

Clarity and detail seem noticeably improved after making these tweaks.

I don't know what's the deal with Equalizer APO I just talked about EQ implementations in general.

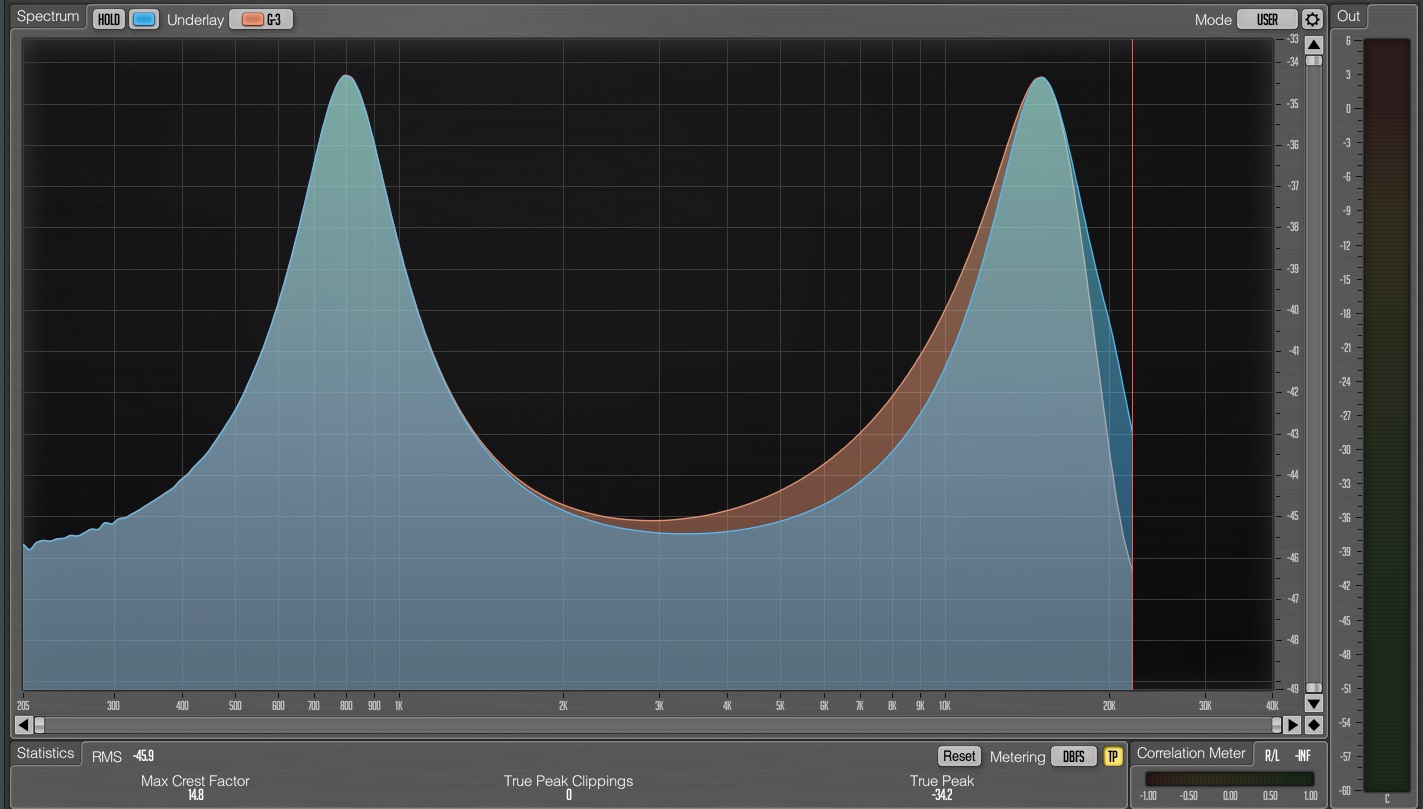
Here's some test I did myself: I set up the same parametric EQ twice, once with oversampling enabled and once with oversampling turned off. One of them was processing the right channel only and one of them was processing the left channel only. I dialed in two peak filters using the same parameters for gain and Q but one of the filters is peaking and 800Hz and the other one is peaking at 15kHz. I played back some sweep and let the EQ process it and checked the spectrum of the left and right channel in both cases.

This is what I found:
The filter peaking at 800Hz behaves the same way with both oversampling enabled and disabled. However the filter peaking around 15kHz (nearing Nyquist frequency) behaves differently with oversampling enabled or disabled. With oversampling enabled the filter creates a peak that's extremely similar to the one around 800Hz but if I turn off oversampling the peak around 15kHz changes compared to 800Hz peak despite having the same gain and Q.


The blue curve corresponds to oversampling enabled. Notice that the peaks are the same at 800Hz and 15kHz. The orange curve (kind of hidden behind the blue one) corresponds to oversampling turned off, notice that the peak at 15kHz is "lopsided" compared to the one at 800Hz.

If this is what you noticed with equalizer APO try to look for something called oversampling or "High Quality" setting or something like that and try to enable it. It should fix this type of problem.

Very interesting stuff, VNandor. I'll look around a bit more to see if there's an adjustment like you describe in the Equalizer APO's configuration somewhere. I kind of doubt that there is though.

Since I've changed the sample rate to 48 kHz, the Nyquist frequency is now slightly higher in the Equalizer APO's Configuration Editor, at around 24 kHz (ie 1/2 the sample rate). And if I place a parametric peaking filter too close to that, then it distorts as shown in the lower right...

QFACTOR.jpg


The Q factor is set to 2, and Gain is set to 20 dB on all the peak filters in the above screenshot. The filter closest to 24k is becoming compressed though. And there's also a little funkiness in the filter at the lowest frequency, around 2 Hz. I assume that's just a resolution thing. Because it's out of hearing range in the infrasonic frequencies. (I would normally not boost the levels in that range btw.)

If I change the Q factor to a Bandwidth setting, then I get a somewhat different issue near the Nyquist frequency of 24k...

BANDWIDTH.jpg


Those are the only two options though with the peak filters. And it was a bit frustrating at first trying to figure out what was going on there. It's manageable though as long as I either keep the peaking filters a bit farther away from that frequency. Or use something like a High-Shelf filter with negative Gain (and a corner frequency of about 20k, and Q around 0.4 or 0.5) to do my HF attenuation, instead of a peaking filter...

NEGHIGHSHELF.jpg


Either approach seems to work though, if the filters are properly configured. In my current diffuse field target response curve, I'm actually using a peak filter at a frequency of 6.3 kHz, with a Q around 0.3 to 0.4 to create a very similar type of HF falloff effect. And I continue to experiment with both methods.

A graphic EQ filter is another option, since those use a simple linear interpolation in this particular software.
 
Last edited:
Mar 1, 2021 at 8:02 PM Post #100 of 103
Since I've changed the sample rate to 48 kHz, the Nyquist frequency is now slightly higher in the Equalizer APO's Configuration Editor, at around 24 kHz (ie 1/2 the sample rate). And if I place a parametric peaking filter too close to that, then it distorts as shown in the lower right...
Those are the only two options though with the peak filters. And it was a bit frustrating at first trying to figure out what was going on there. It's manageable though as long as I either keep the peaking filters a bit farther away from that frequency. Or use something like a High-Shelf filter with negative Gain (and a corner frequency of about 20k, and Q around 0.4 or 0.5) to do my HF attenuation, instead of a peaking filter...
It definitely looks like equalizer APO doesn't prevent frequency warping. I mean, it's not a big issue. After all, the filters are working as expected for a large amount of the frequency range, and it just makes it harder to work out the desired response at high frequencies.

And there's also a little funkiness in the filter at the lowest frequency, around 2 Hz. I assume that's just a resolution thing.
The filter works properly there, it's only the visuals that aren't reflecting the actual frequency response of the filter.
The graph you are looking at is logarithmic but the calculations used for displaying the graph are linear. Let's just say the program creating the visuals for the frequency response looks at what the gain is at every integer frequency and plots that at the display. The peak filter at 200Hz creates a "bell shape" from about 100Hz to 300Hz so there would be 200 (okay, 201 actually) points to draw a graph from. The peak filter at 2Hz goes from about 1Hz to 5Hz and since the program would still only calculate the gain at integer frequencies, it would only use 5 points to draw a graph from.
 
Mar 1, 2021 at 8:57 PM Post #102 of 103
Because it's out of hearing range in the subsonic frequencies.

Since this is the Sound Science forum, "subsonic frequencies" really should have been infrasonic. Changed above.
 
Mar 1, 2021 at 9:28 PM Post #103 of 103
We aren't that picky.

Well, most of us...
 

Users who are viewing this thread

Back
Top