HD620S measurement results
A HeadFi-user recently sent me their HD620S, I thought some people in here might be interested in the results.
Positional variation
Frequency Response
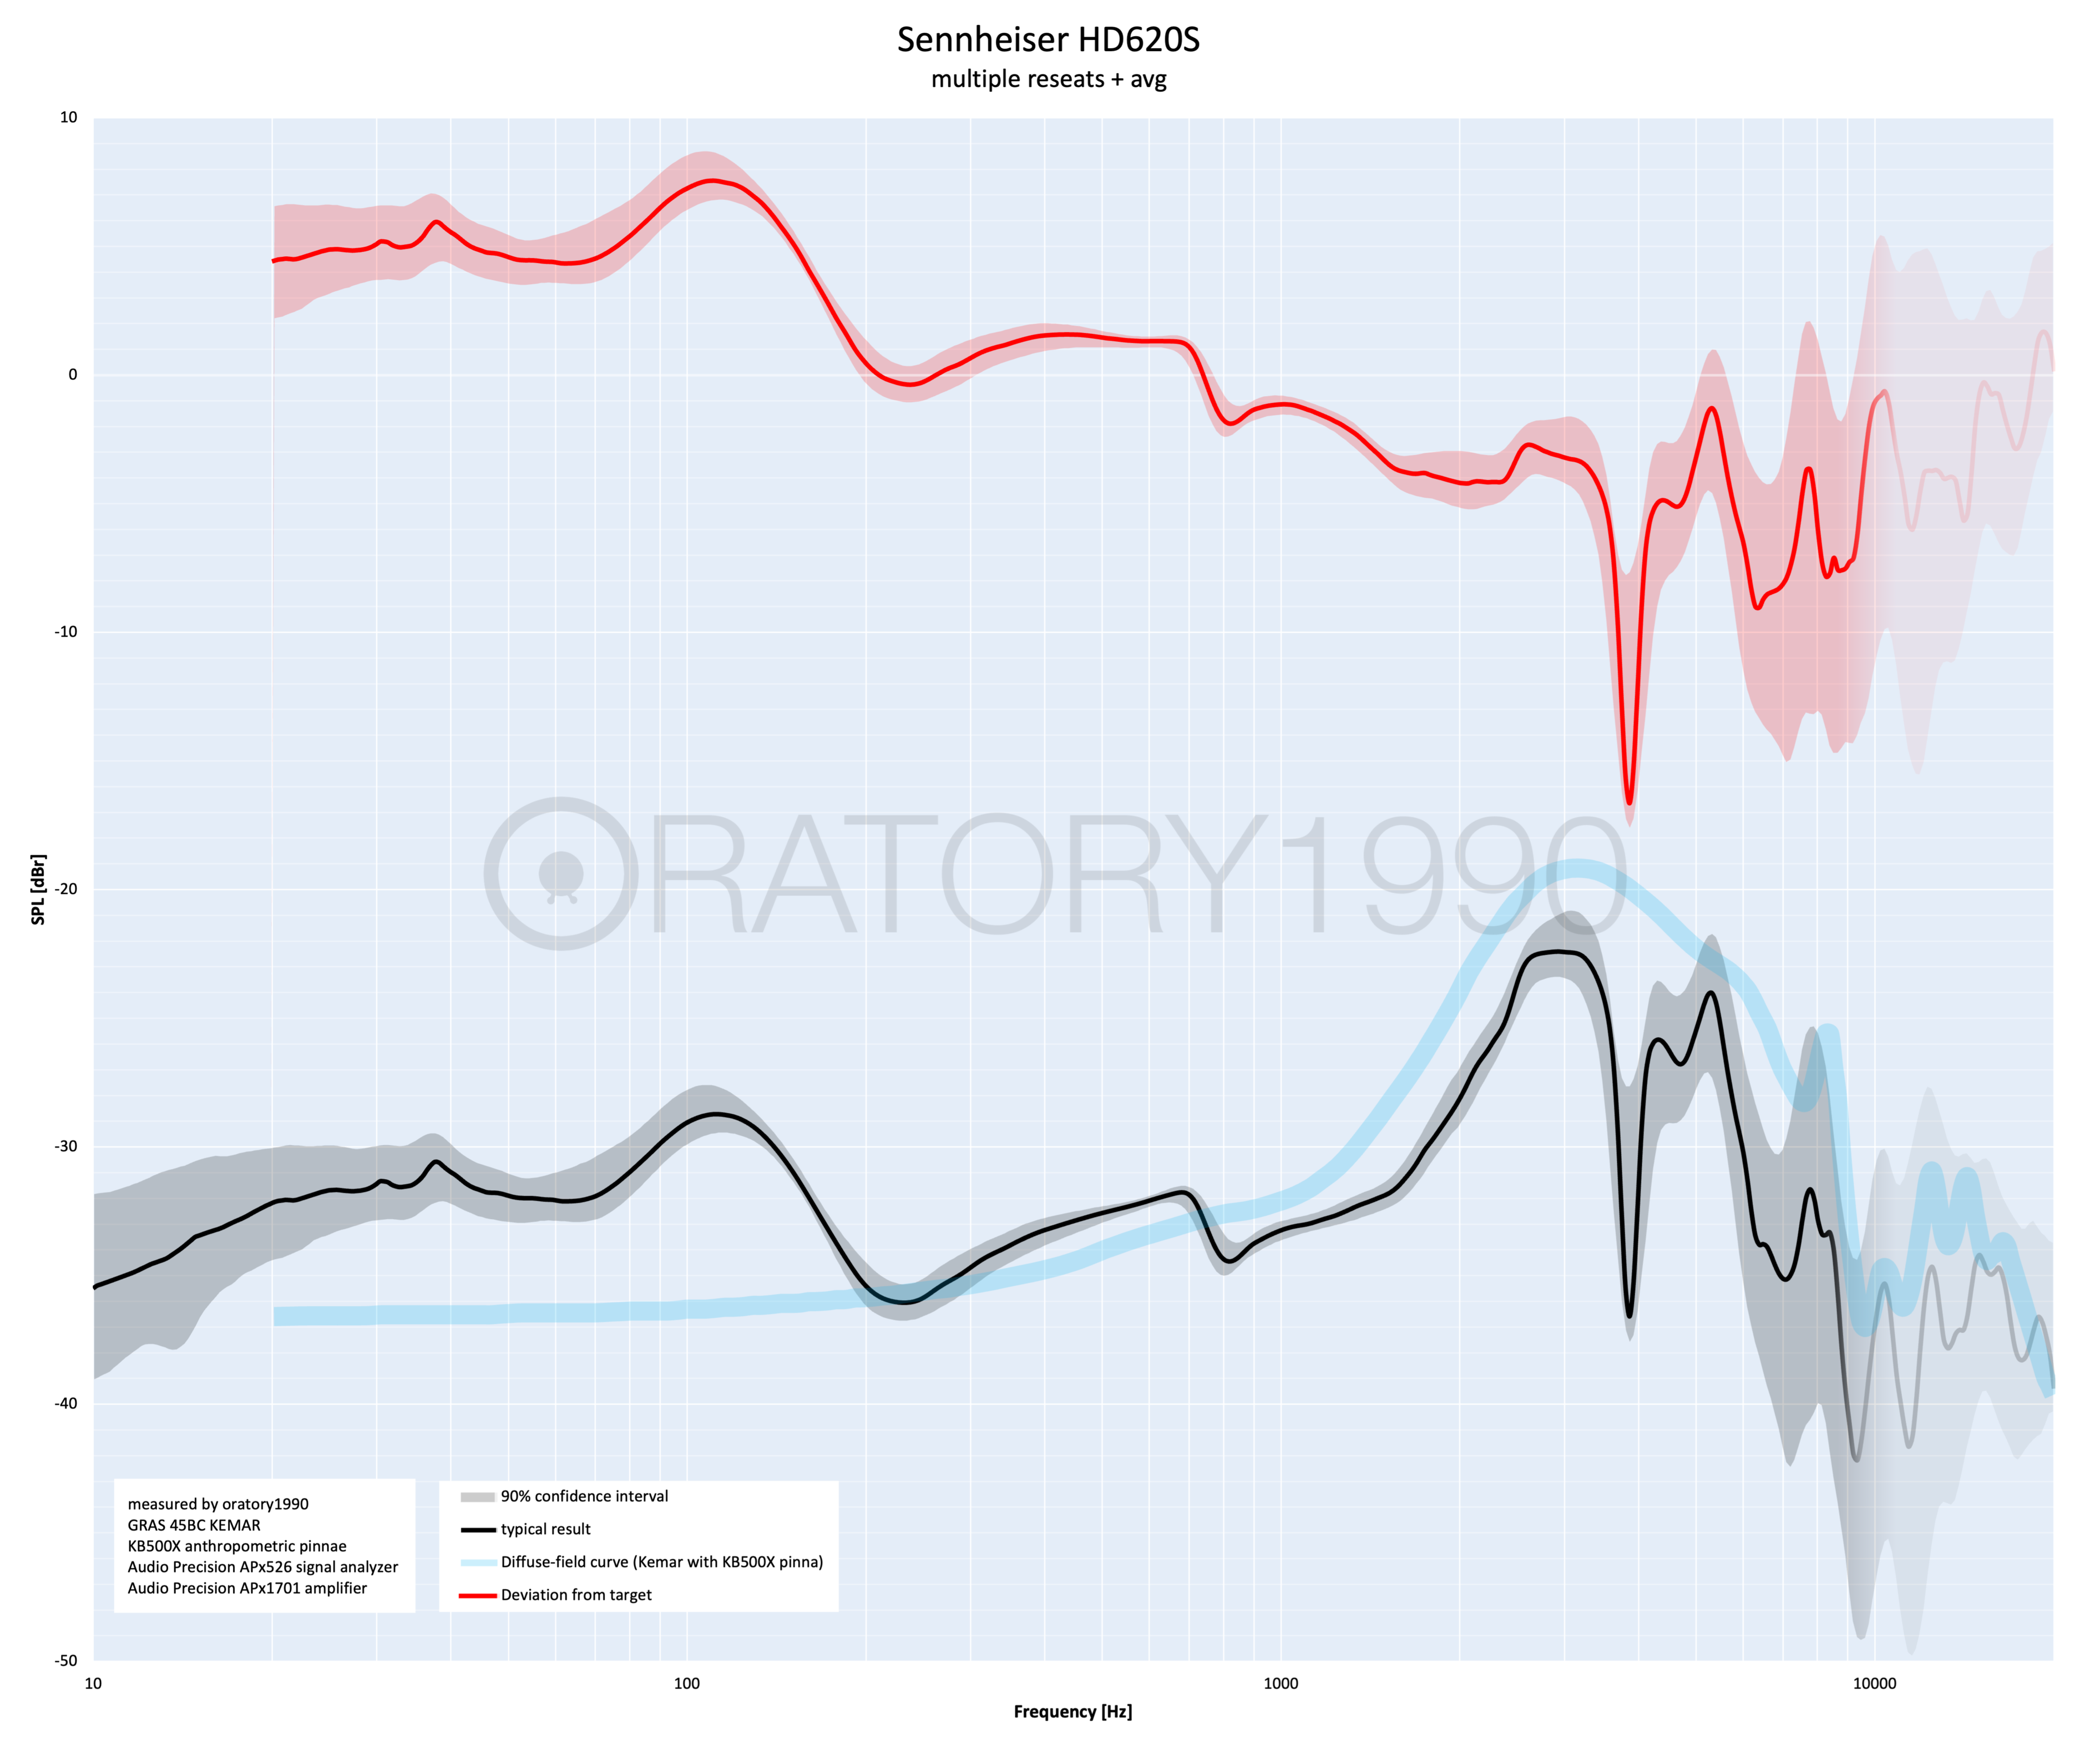
The results below show an average across multiple positions of the headphone on the measurement setup.
Also shown are 90% quantiles - meaning 90% of positions fall inside the shaded area. I measured a total of 27 positions.
You can see how for a large range of frequencies, the exact position of the headphone does not significantly affect the result, but especially for higher frequencies there
is some variation. The amount of variation is within the expected range for a closed-back, over-ear headphone.

Frequency response compared to the Harman Curve. Low deviation from this curve is generally desirable

Frequency response compared to the appropriate diffuse-field curve. Low deviation from this curve is generally
not required. Good-sounding headphones typically exhibit somewhat of a downwards tilt in their diffuse-field compensated frequency response.
(This diffuse field curve was measured on our actual KEMAR dummy head, it deviates slightly from the one published by GRAS)
Group Delay
This may not be fully clear for everyone: If the magnitude frequency response changes with position of the headphone on the dummy head, then so does the phase angle frequency response, and hence by definition so does the group delay:

Nonlinearity / Sensitivity
To test the headphone's nonlinearity, I measured at multiple different signal levels (3 dB steps across a range of 27 dB)

some nonlinearity can be seen here. To make it more easily visible, I divided the obtained sound pressure by the input voltage. This gives us the
voltage sensitivity ("decibel per volt") of the headphone.
In a perfectly linear system, the frequency response would not change with input levels, so dividing the obtained sound pressure by the input voltage would result in perfectly overlapping graphs.
Using the same color coding as above, we can see how for high input levels the sound pressure deviates slightly from the expected value:

Roughly speaking, this headphone has about 110 dB/V voltage sensitivity.
If we plot only the
deviations from perfectly linear behaviour, we get the graph below (same color coding as above):

And zoomed in on just frequencies below 1 kHz, and zooming in on the Y-scale, looking just at +/- 2 dB:

So we see that for frequencies below ~100 Hz, the sensitivity decreases (the sound pressure increases by a lesser amount than the input voltage), while at around 200 Hz the sensitivity actually increases somewhat for higher input levels. This is typical for a vented closed back headphone of this design, and not too worrisome.
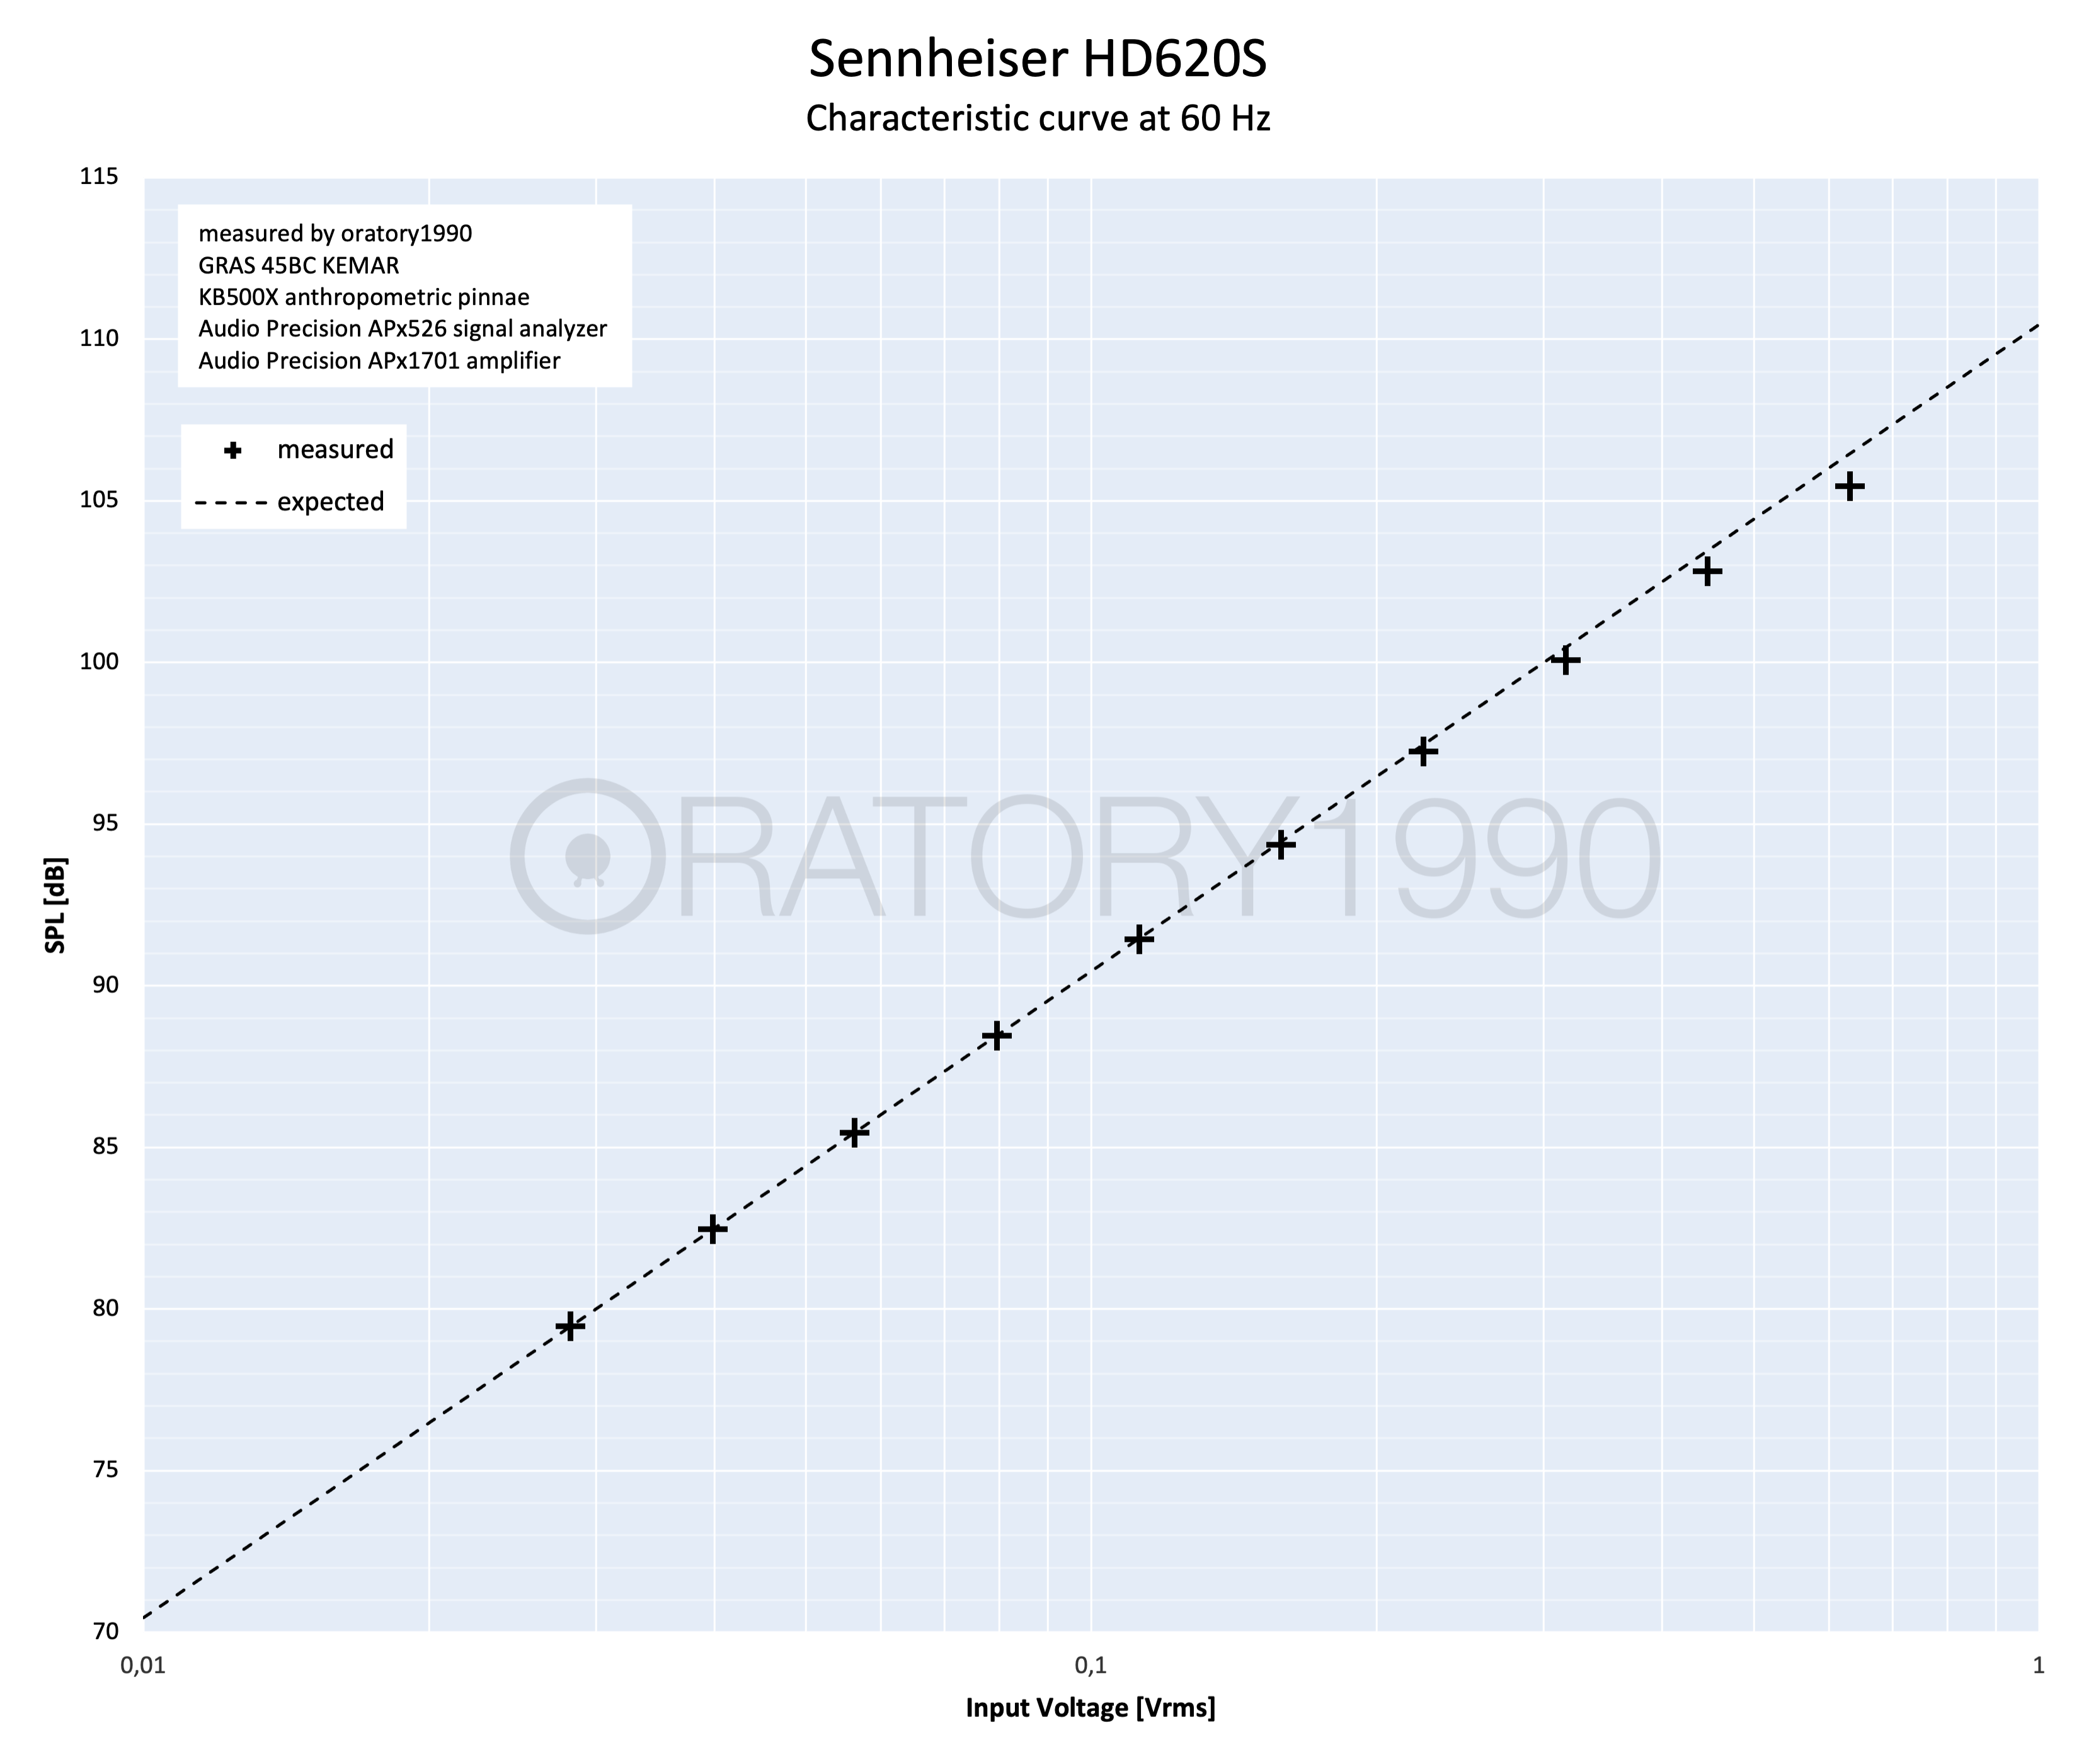
If we look at just the values at 60 Hz (where the nonlinearity is highest), we can plot the SPL as a function of input level (this is called the "characteristic curve"):

This lets us observe the deviation from linear behaviour.
For comparison, the characteristic curve at 1 kHz is almost perfectly linear:

An even more direct observation of the nonlinearity can be visualized by dividing the sound pressure by the input voltage (looking at the voltage sensitivity), where we can very clearly see how for high input levels the sensitivity drops for 60 Hz, but remains unchanged at 1 kHz:


Distortion
The above observed nonlinearities in SPL must come hand in hand with an increase in distortion (the nonlinear characteristic curve is the mechanism that creates THD), and to no surprise, we do see high THD at high input levels (same color coding as above):

The apparent peaks at 4 and 7 kHz are correlated with narrowband dips in the magnitude frequency response, they don't show an actual increase in absolute distortion values.
And again, looking at the distortion just at 60 Hz tells us "how much" distortion this headphone has.

We can go to about 102 dB before crossing 3% distortion at 60 Hz (which is a very low estimate for the audibility threshold of THD at such a low frequency).
Listening at 85 dB average level would give us a headroom of at least 17 dB. That's not bad.
For comparison, the same graph for 1 kHz. No issues there.

Unit Variation
measured 6 units so far, variation in between units is not too bad:

EQ recommendation
HD620S - EQ to Harman 2018