Ah, I shall revisit this thread again. : )
What exactly do these numbers represent?
http://www.dynamicrange.de/sites/default/files/Measuring%20DR%20ENv3.pdf
http://dr.loudness-war.info/
I usually define absolute dynamic range as the difference between the softest and the loudest points. That is quite literally how dynamic the music is and your amplifier would need to be able to produce sound from the softest part to the loudest part without clipping and with the proper slew rate if the music demands it.
For calculation purposes though, that's not a practical metric since software usually can't identify/tell you the quietest points within a given music piece unless there's complete silence like in some synthesised music. Using a track's RMS and peak values (thus crest factor) are much more indicative of the dynamic range for this purpose. The RMS value represents the continuous/sustained load on an amplifier, whereas the peak represents a sudden power surge requirement from the amp. This makes complete sense to me for determining a music track's dynamic range, how much change is there in the music from the average level? The crest factor is also commonly used for speaker amps to determine how powerful of an amp you'll need. A VU meter is also indicative of the RMS values and average volume level of a given music piece for loudness monitoring.
The DR utility does something completely different from anything above and I don't see how it can be indicative of a given music track. The largest 20% of the RMS values doesn't tell you anything useful for either the music track nor the requirements for an amplifier; it isn't indicative of how loud the music track is from the peak values for a dynamic range calculation and it makes the track seem artificially louder than it really is, as evident by the much lower RMS values determined by Audacity, Musicscope, and Foobar's ReplayGain values.
From the spec sheet posted above, 132300 samples are analysed in a 3-second block for a 44.1 kHz sampled file for each channel. For those 132300 analysed points, one RMS and one peak value are determined. The RMS calculation isn't really an RMS value to begin with since the radicand is multiplied by 2 when RMS calculations don't have that factor, no? So it's erroneous right there and is already inaccurate. If you have a 3-minute song, that means 60 RMS and 60 peak values are generated (one for each 3-second interval) for each channel, which means a blknum of 60. The RMS-sum is just the total RMS value (single number) for the whole channel, which is based on the inaccuratly calculated RMS values. To get the top 20% values, they divided the total RMS's radicand by 0.2 * blknum (12 in this case).
Say you have these made-up 60 values from the RMS calculation:
Code:
Ten values of -6.7
Ten values of -7.3
Ten values of -6.4
Ten values of -5.8
Ten values of -6.9
Five values of -5.3
Five values of -5.0
Sum of Squares = 2469.35
Sum of Squares / 12 = 205.78
Top 20% Total RMS value = sqrt(Sum of Squares / 12) = 14.35
With our simple numbers, we can double-check this.
Reordering the values from smallest to largest:
Code:
Ten values of -7.3
Ten values of -6.9
Ten values of -6.7
Ten values of -6.4
Ten values of -5.8
Five values of -5.3
Five values of -5.0
Obviously the top 12 values representing the top 20% RMS values are the five -5.0 values, the five -5.3 values, and two of the -5.8 values.
Sum of Squares for top 20% = 332.73
Top 20% Total RMS value = sqrt(Sum of Squares for top 20%) = 18.24
18.24 ≠ 14.35
So even the "top 20%" RMS values they calculate are inaccurate from the samples they take.
The spec sheet says:
Using the RMS-sum in (4) results in the overall RMS of the upper 20% of the input material, eliminating the contribution of small Peaks. This method also ensures that the resulting DR value is virtually independent from the block size used (3s in this example) as long as this is small compared to the overall input material length.
Limiting the DR-measurement to the upper 20% of the blocks with maximum RMS is a compromise that allows to somewhat compare a wide variety of different material in a quantitative way. Also in highly dynamic Material only the loudest parts, which usually best reflect the processing of the material (compression etc.), contribute to the DR measurement.
What would be an example of when small peaks would greatly alter the calculated RMS value in such a way that the true RMS value isn't good enough or indicative of the whole track? I guess I just don't understand why the DR utility uses the highest 20% of calculated values. Literally no other sources I've seen and read use this convention and instead use the crest factor for dynamic range determination, which makes sense to use unless you can provide a concrete example of when the DR utility would be a better convention to use.
To me, the crest factor (peak minus RMS value in dB) is a far better indication of the dynamic range than what the DR utility outputs.
For example, here's a song from a video game soundtrack that I really like:
[video]https://www.youtube.com/watch?v=RZl8WKO0FV8[/video]
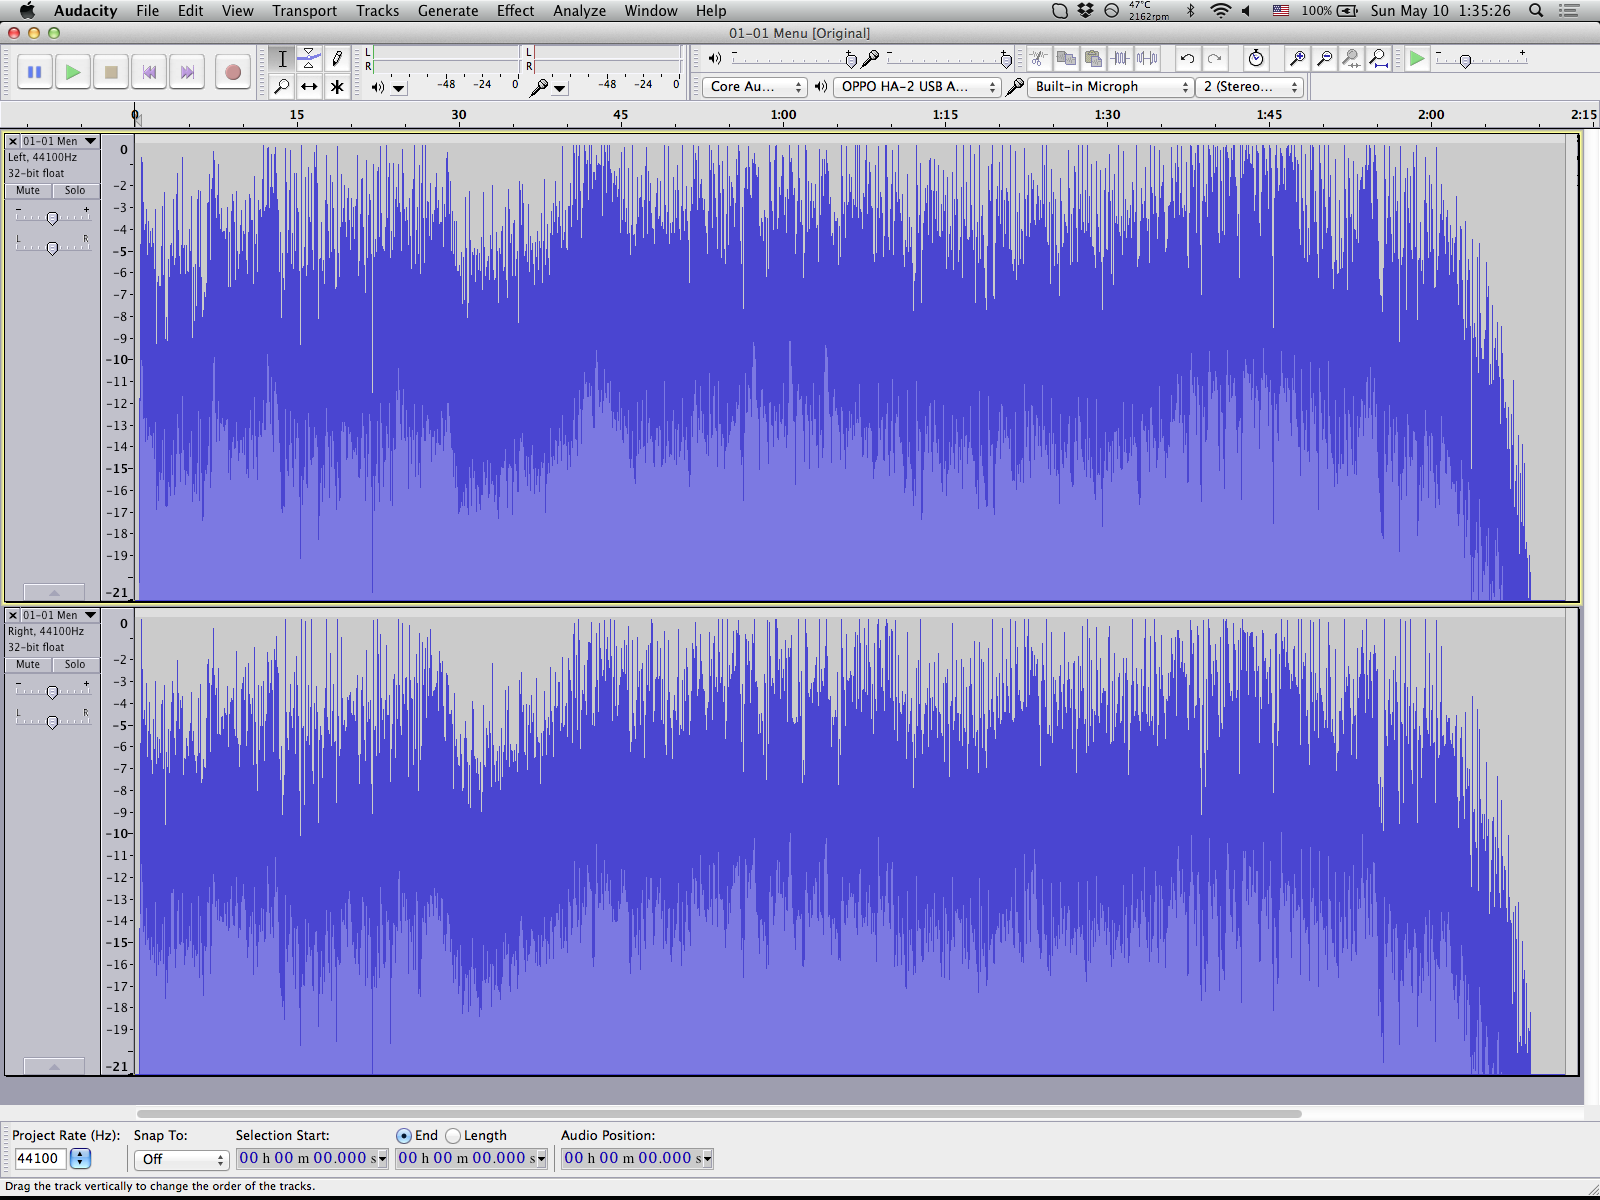
Here's its corresponding decibel waveform in Audacity:

The light-blue area represents the loudness of the song, or the sustained/RMS values. If you just eyeball the approximate average level of this area, the left channel looks to be at around -13 or -14 dBFS and the right at around -14 or -14.5 dBFS. Subjectively, I hear that the right channel seems to have less stuff going on, so it makes sense that the right channel has a slightly quieter average volume level/average RMS value.
You can use Audacity to objectively determine the average of the RMS values by doing a "Contrast" analysis.
http://manual.audacityteam.org/o/man/contrast.html

Indeed the right channel is quieter based on the average RMS value it calculated (-13.7 dBFS vs -14.3 dBFS).
For peak values, you can use Audacity's "Amplify" (without clipping) effect. This will bring the song to as loud as it can get, 0 dBFS, without clipping. Both the left and right channels can only be increased by 0.1 dB for this particular song, so that means the peak values for each channel are -0.1 dBFS.
From the average RMS values and the peak values, you can determine the crest factor for each channel.
Left: -0.1 dBFS peak - -13.7 dBFS RMS = 13.6 dB
Right: -0.1 dBFS peak - -14.3 dBFS RMS = 14.2 dB
We can average the two crest factors to get the crest factor for the whole song: 13.9 dB
So this represents how much variation the song has between its average loudness level and its peak levels.
What does the DR utility output?
Code:
 Left Right

Peak Value: -0.10 dB --- -0.10 dB
Avg RMS: -10.77 dB --- -11.38 dB
DR channel: 8.95 dB --- 9.87 dB
Official DR Value: DR9
That doesn't seem right to me....