


- Joined
- Aug 2, 2008
- Posts
- 5,408
- Likes
- 1,327
How many LCD3s have you measured? If we're talking variance shouldn't you need to test a lot of LCD3s to report variances?
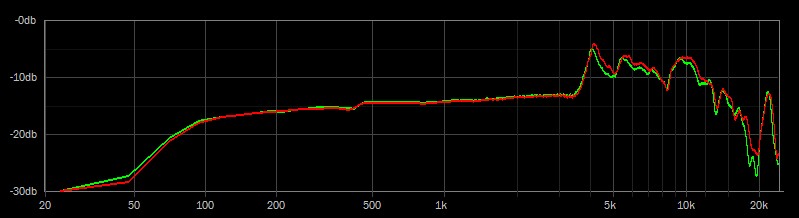
We are talking about variances with the Audeze supplied graphs.
I'm really loving the graph on the HD800 there.
Tyll says they use laser beams to design and test their headphones.
Quote:
I think Audeze made a mistake supplying their graphs. It's got too much smoothing and doesn't show both channels and there's too much variance in the positioning for them to mean anything (according to yall anyways). Or there is actual variance in the drivers. Either way, the only thing they contribute is paranoia. If I paid 2k and got a graph that had a weird valley I'd rip my own nuts off.
I get why they wanted to, because professional speaker monitors come with them (or at least mine did) so it gives them that nice flava flave but they ought to either be meaningful or axed IMO,
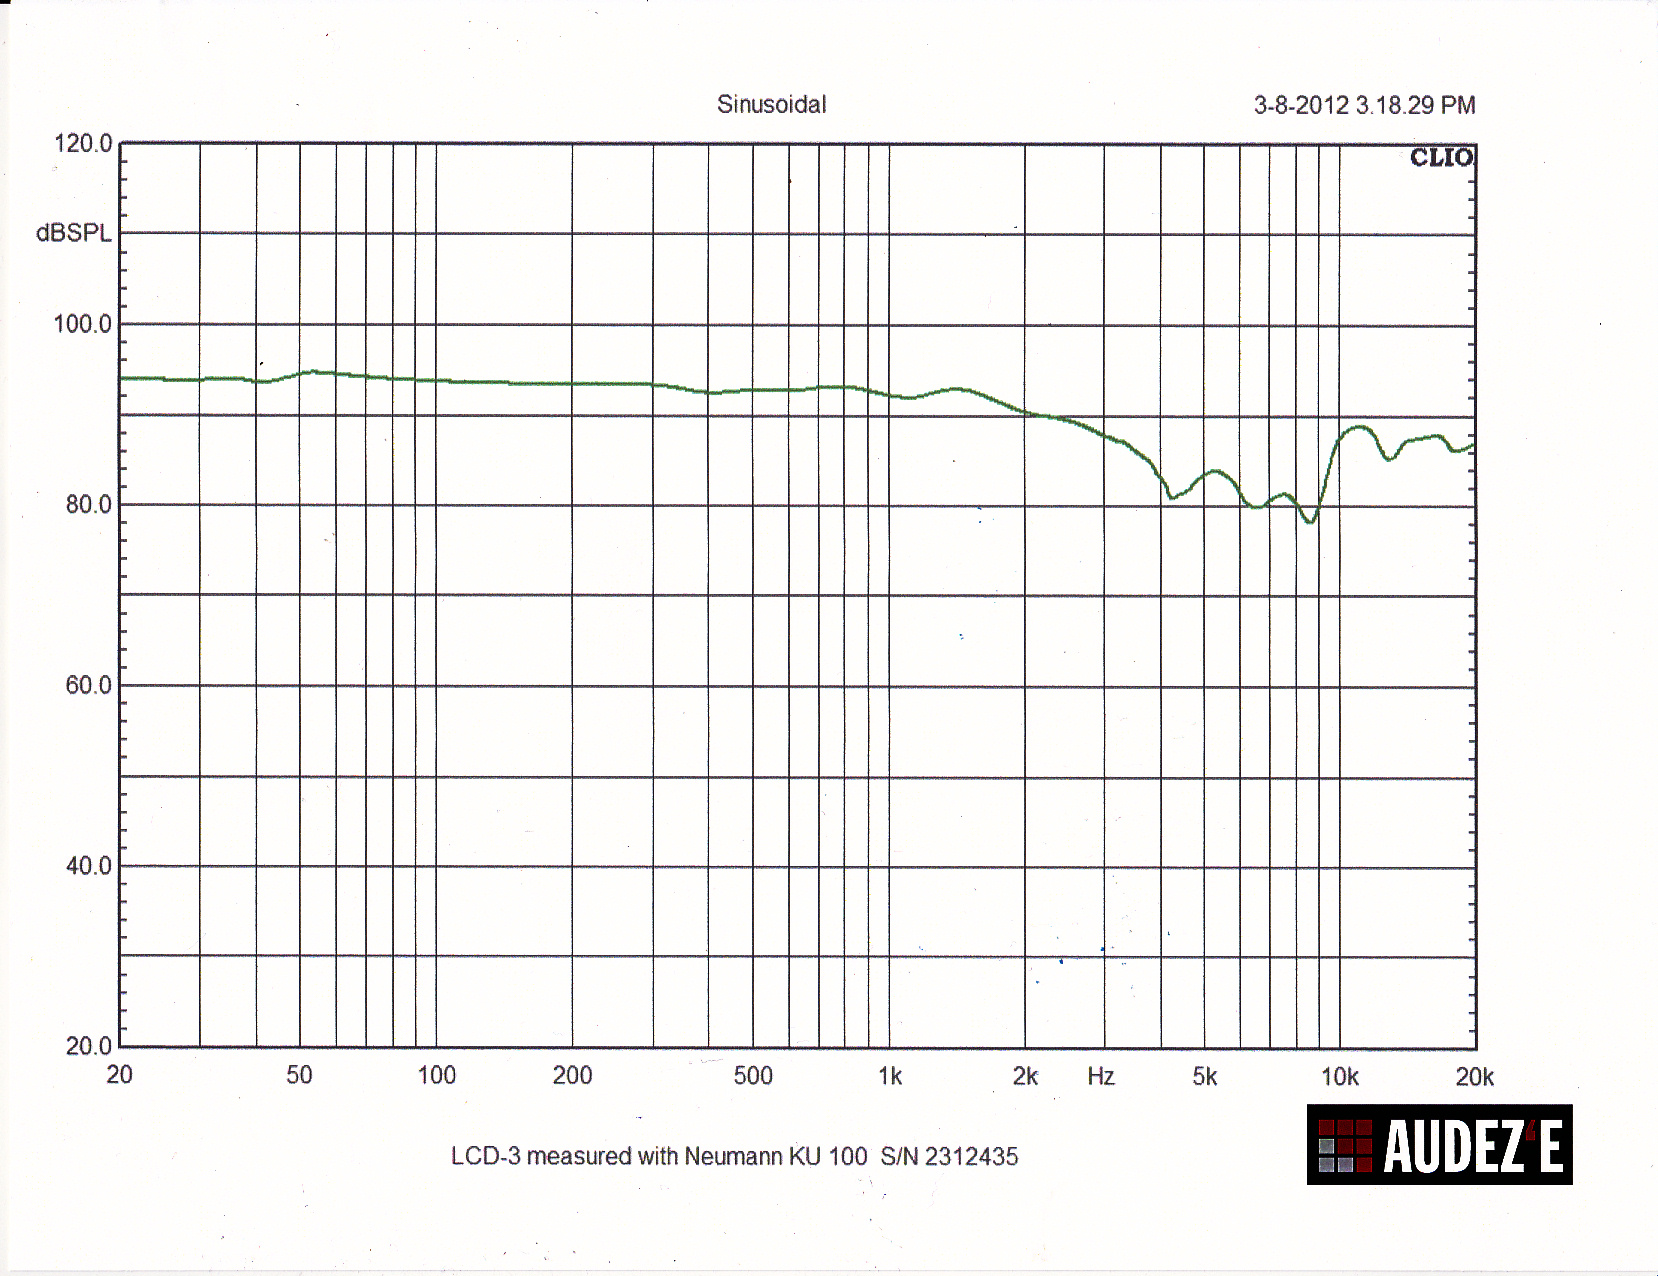
I have to admit that DK's graph with the wierd narrow dip at 9k looks semi-disturbing. I were going to be providing FR graphs to customers, I would have taken a closer look at that one (re-position the headphone or junk the driver) so they (customers) don't rip their own nuts off or freak out.
Then again, my own measurements show a similar dip at 12k on my pair, and it sounds just fine, at least with music, but now you got me thinking about running test tones through them...


