


- Joined
- Aug 2, 2008
- Posts
- 5,408
- Likes
- 1,327
LCD3 Measurements
Not putting this in the usual CSD thread. This concerns a LCD# which deserves it own.HOW DO I READ THESE?
Cumulative spectral decay (CSD) or waterfall plots measure energy content over time across all frequencies based on a "sound burst" that excites all frequencies. They are sort of like a FR over time (technically not really as they measure energy throughout the band in successively smaller windows over time.) These plots are a good tool to "see" driver ringing or resonances (seen as ridges), which typically sounds bad (piercing, glare, shoutyness, etc.); and how fast and cleanly the driver decays (speed and extraction of low level information.)
This is what a perfect waterfall plot would look like:
For a perfect or near-perfect response, the decay should be immediate. We first see a wall (meaning all frequencies are excited) at the beginning. The next few fractions of a millisecond, the wall collapses into silence (meaning the driver is no longer vibrating or sound waves are no longer bouncing around inside the headphone enclosures.) The back wall at time = 0 is basically an uncompensated frequency response. Success plots over time move toward us.
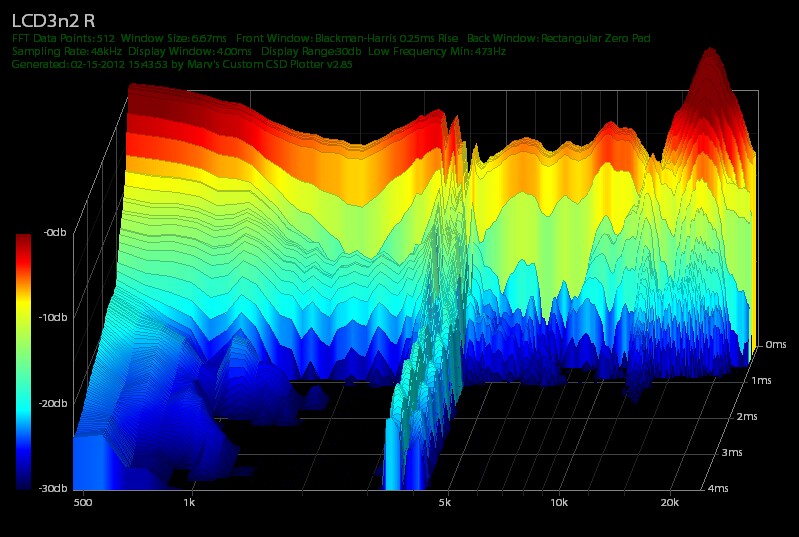
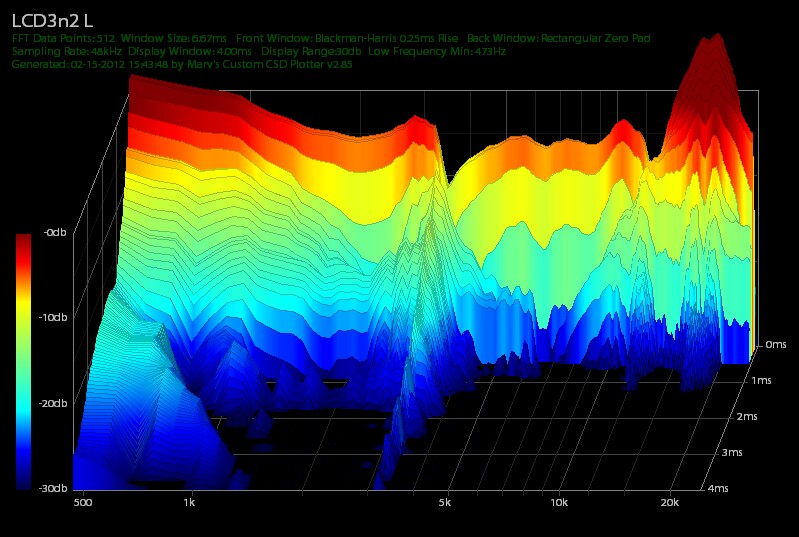
LCD3 CSD
These are not FR plots, although some idea of the FR can be gathered from t=0 plot.The waterfall plots below only go down to 100Hz not 20Hz!
Waterfall plots confirm subjective impressions that the LCD3 is extremely smooth in the upper midrange and treble. No ringing at all in the critical area between 6kHz to 10kHz. The upper midrange and treble FR is much smoother than r2 below. An rising response from a slight null 13kHz peaking near 17-18kHz. Most people can't hear well way up here anyways. Some minor hash (likely interaction with the pads) on the floor between 2 to 3kHz - not really audible.
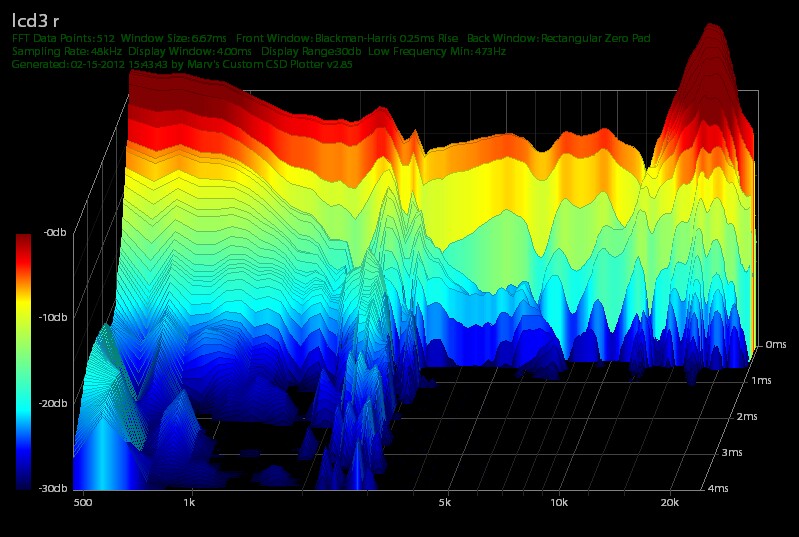
LCD2r1 waterfall provided for reference
These are not FR plots, although some idea of the FR can be gathered from t=0 plot.It should be noted that this was one of the better sounding (and better measuring) LCD2s that I've been able to get my hands on.
The waterfall plots below only go down to 100Hz not 20Hz!
LCD3 Impulse Response
The amp I used reverses the phase of the impulse response.At a glance, this impulse response looks horrible. This is why we have to be careful when evaluating measurements, especially if we have no idea what they really represent, what they mathematically mean, or how they should be used. Anyone care to guess what's causing a high magnitude short duration oscillation after the initial impulse that takes about ~0.6E-04 seconds to cycle?
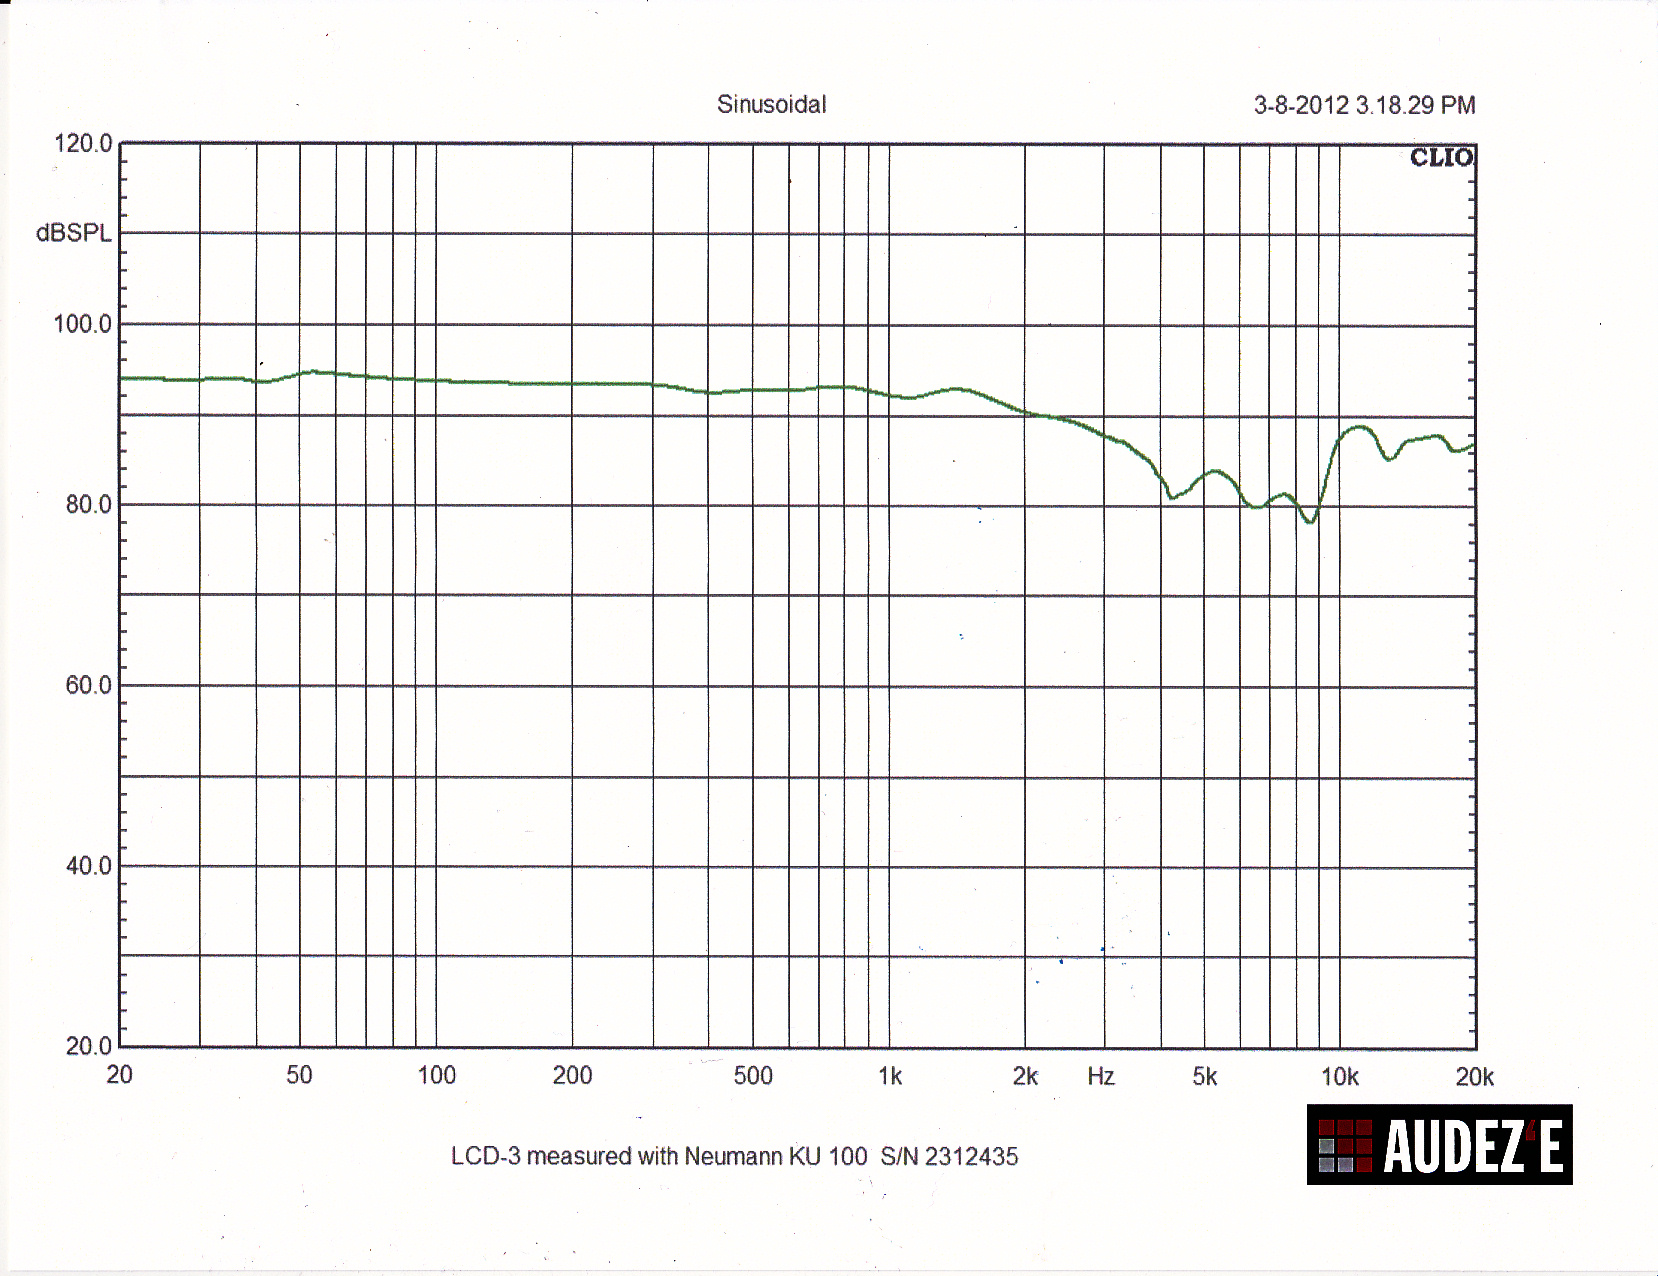
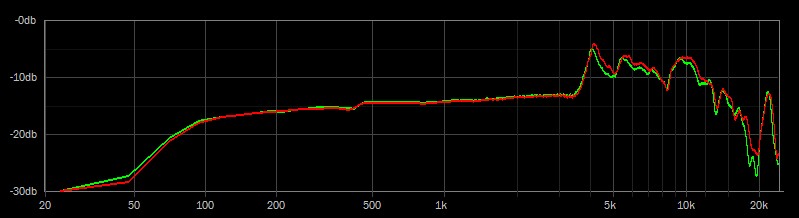
LCD3 Frequency Response
Left and right drivers are well matched and within measurement error and ear pad variation tolerances. The measurement in the bass area appears to be rolled off. The bass measurement probably needs compensation for lack a good seal.
LCD3 COMPARISONS WITH OTHER HEADPHONES
Clicky: http://www.head-fi.org/t/580283/lcd3-measurements/15#post_7892979GRAPH OF THE TITANS: http://www.head-fi.org/t/580283/lcd3-measurements/45#post_7898177


 . Wasn't convinced tyll I saw the bump at 17k in the frf. I am amazed they got rid of any visible resonance in the diaphragm even though it's so much finer from previous generation ! As for the impulse response looking bad, well that peak at 17k is pretty nasty (even though it might go unnoticed or even be appreciated).

