


Naim.F.C
1000+ Head-Fier
- Joined
- May 20, 2008
- Posts
- 1,149
- Likes
- 286
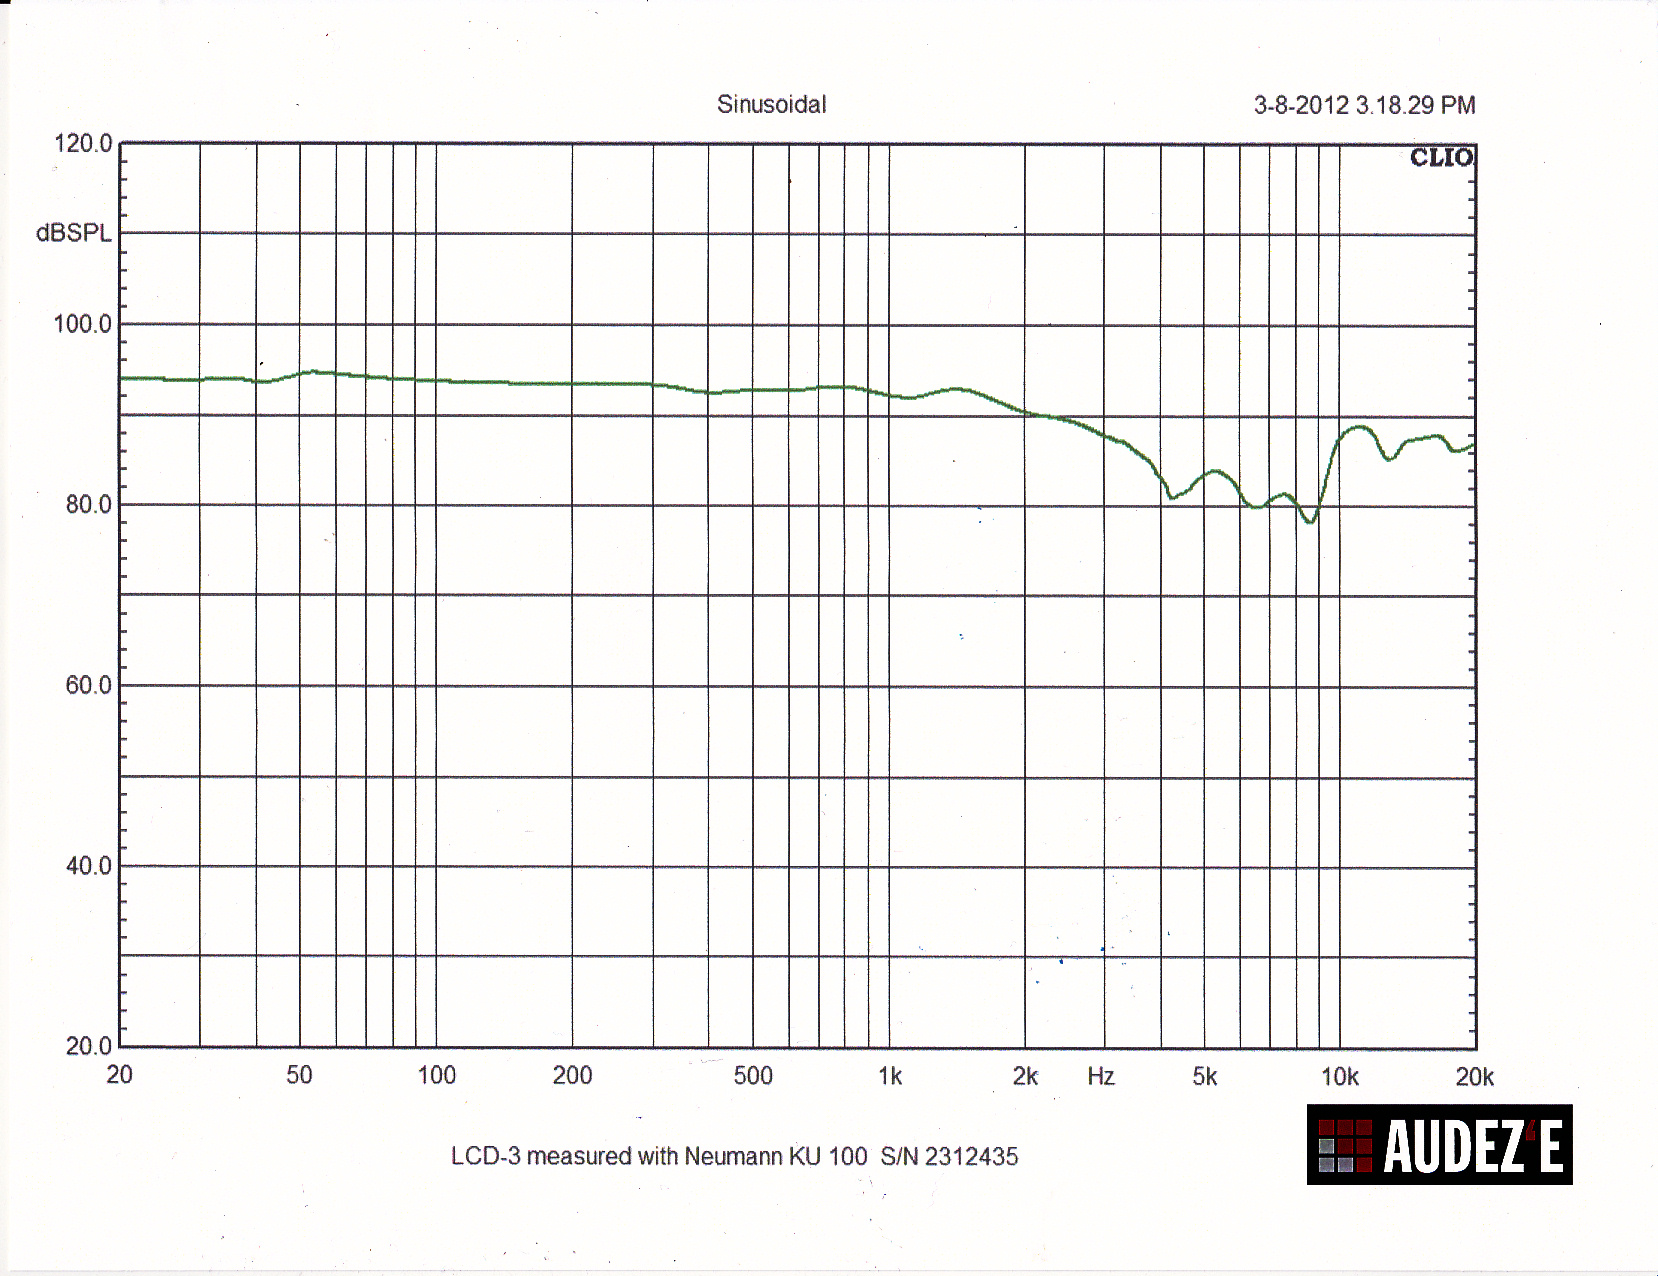
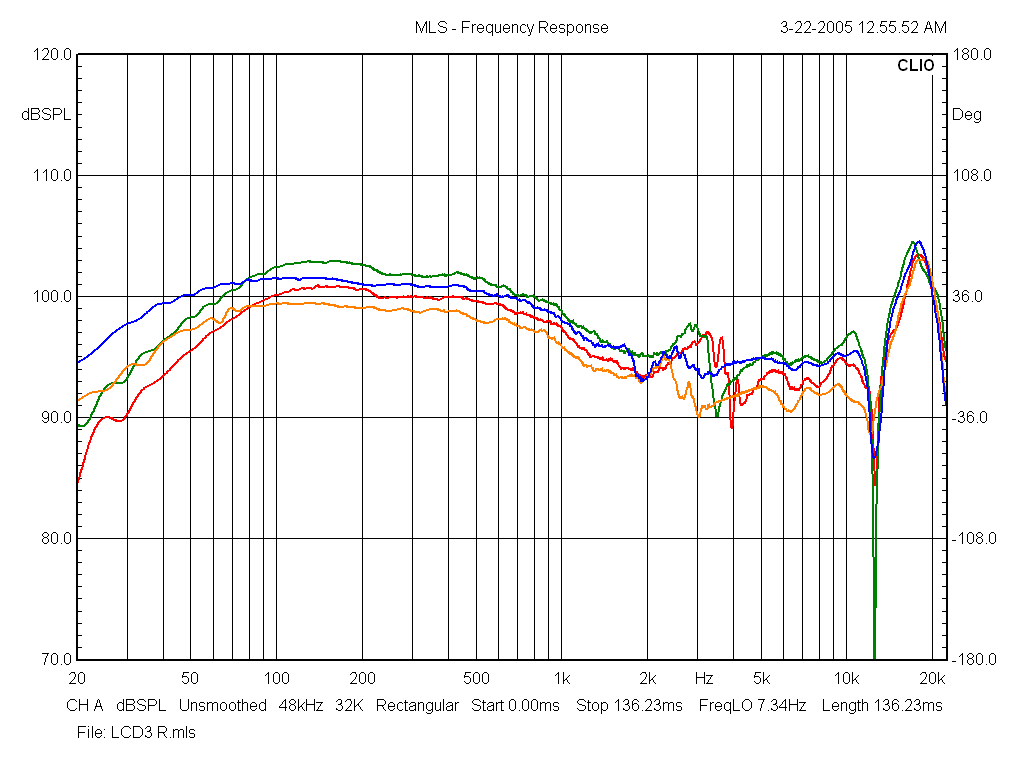
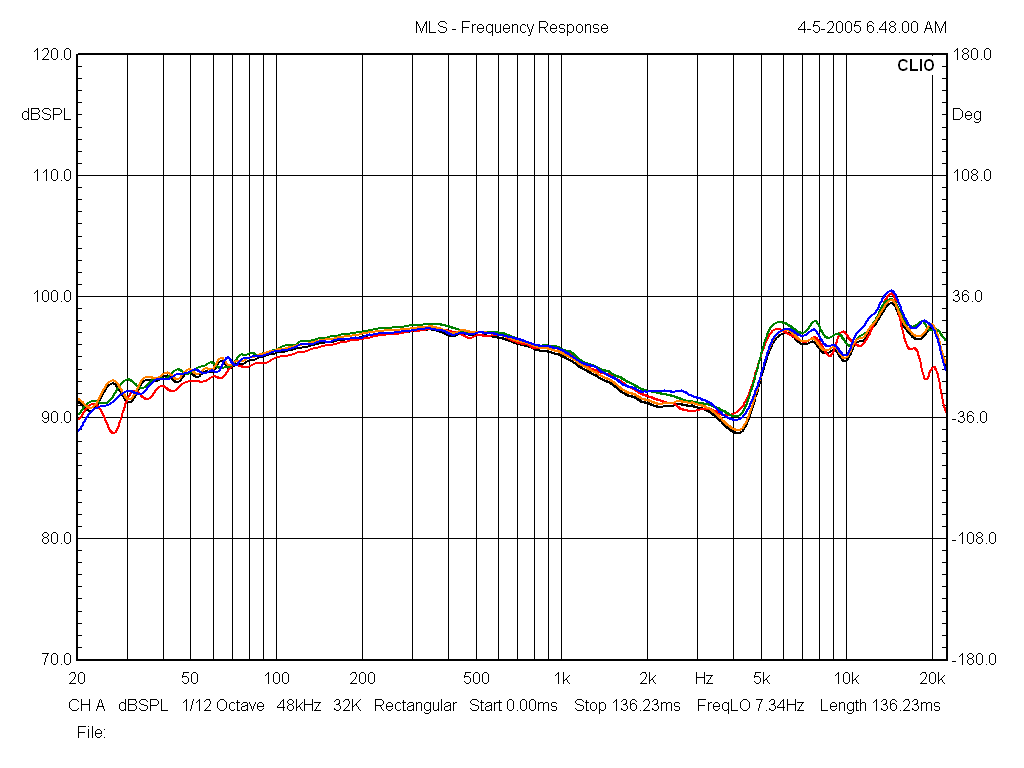
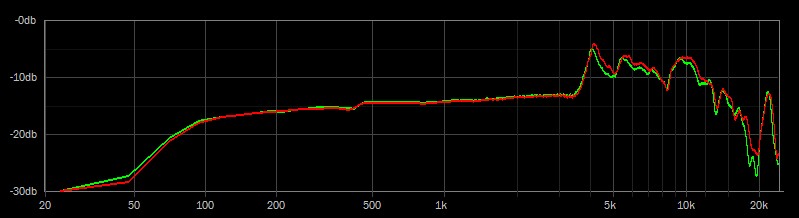
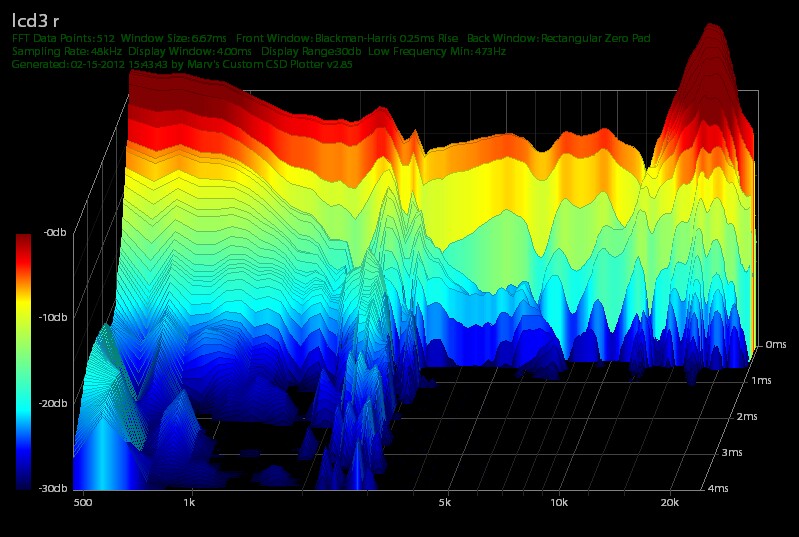
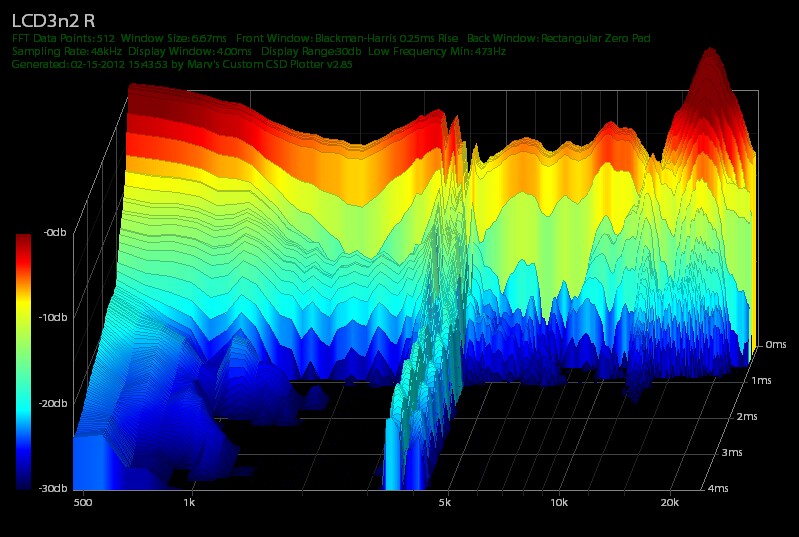
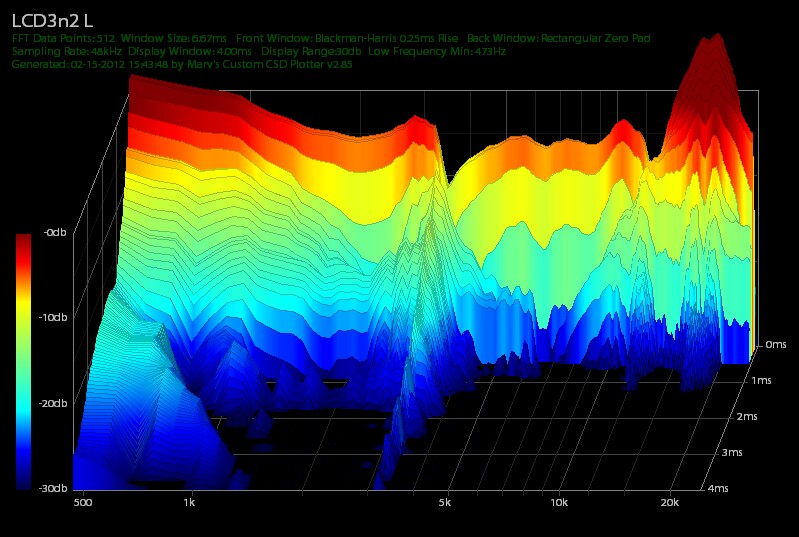
The main frequency graph doesn't show nearly as much variance, but I'm not well versed with these things and don't know how the other comparison affect things in the grand scheme. Is there a version of the PDF linked for the LCD-3 and LCD-2? One that also shows the other graphs.
http://www.innerfidelity.com/images/BeyerdynamicT1SN3964.pdf
http://www.innerfidelity.com/images/BeyerdynamicT1.pdf
Looks actually more so as the square wave responses vary quite a bit too.

