| Description: | Graph Amplitude Range: |
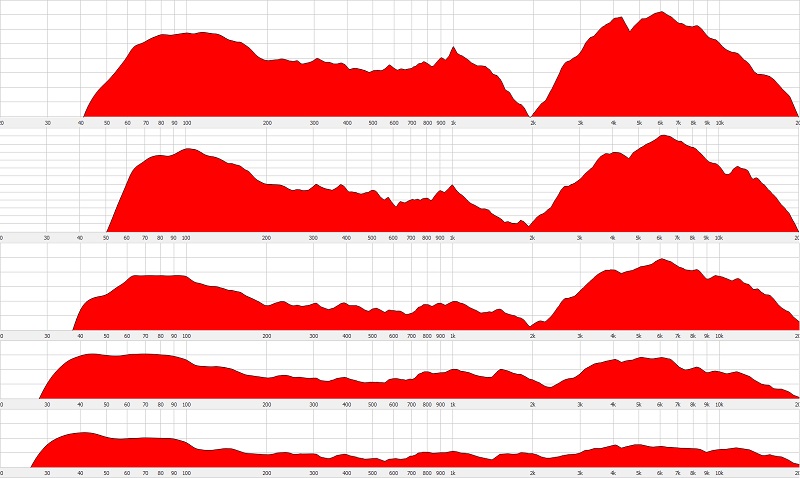
| 10 "V-shaped" loudspeakers with a flat direct response | 4 dB |
| 25 loudspeakers with a flat direct response | 2.6 dB |
| Top 10 best extended loudspeakers with a flat direct response | 3 dB |
| Top 5 best extended loudspeakers with a flat direct response | 4 dB |
| Top 3 best extended loudspeakers with a flat direct response | 6.67 dB |
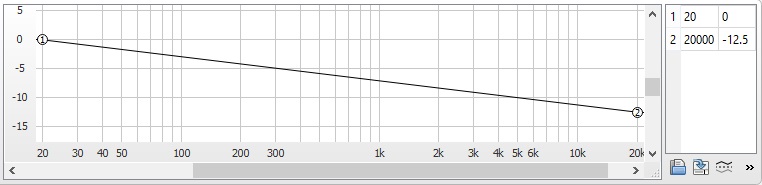
Just a quick followup to show how one might derive a 5128 target response curve from some of the above sound power info. This is my rather crude attempt at approximating the offsets to a slope, illustrated in the sound power data shown in my previous post above. The only slight adjustment that I made was to extend the falloff in the bass all the way down to 20 Hz (mostly for neatness)...
I also chose to make the boost in the bass and treble the same height or amplitude, based on the responses of some of the better-extended speakers shown in the previous graph above. Rather than using the larger samplings (with less well-extended responses) as a guide for the response in that area. This is just a rough preliminary guess though at an appropriate correction curve.
Combining the above offsets with a -1.26 dB per octave slope, and the HBK 5128 diffuse field compensation curve results in a (potential) target response approximation curve that looks something like this...
The best match I have seen so far to this is
an early version of the SoundGuys 5128 target. Which I believe was based just on averaging together the responses of a number of different headphones measured on the 5128 rig that they felt were of reference quality. The overall shape of the two curves seems very similar to my eyes. But YMMV on that.
The example 5128 target response curve shown above is still very much a work in progress btw. Which hasn't been tested with any actual headphone gear yet. And like Harman's target for the GRAS system, it would only be useful as a
general approximation curve. Because it doesn't capture enough fine detail in the treble, to really be useful for more accurate plotting in that range. For those who are still somewhat new to headphone graphs and plotting, it's important to understand that there really
should be some bumps and dips in a headphone's treble/high frequency response (particularly in between the peaks at around 3k, 8k and about 16k, in this case). And that is completely normal behavior for a headphone, which should not generally be smoothed over or corrected out!... Just as with the GRAS FR data. The
peaks in the headphone's treble response should probably follow a curve something like the one posted above though, for something approaching a well-extended neutral response.
The main reason for posting this here is simply to illustrate that there are, in fact, other ways of deriving a target response curve for a rig like the HBK 5128, based on science and high-quality measurements, which may not necessarily have to involve alot of expensive subjective listening tests. (Though it would certainly be nice to eventually have some of that done as well. As well as some actual
in-ear measurements of higher quality neutral loudspeakers in a typical domestic listening space, made on the 5128 HATS rigs.) Using HBK's
excellent 5128 diffuse field response curve, combined with some kind of a slope that roughly approximates a speaker's sound power response, is not such a bad place to start for something like that, imho, if you have no other resources at your disposal. And one of the rather nice things about using an approach like this is that you can be somewhat selective, and experiment with some different types of speaker response curves to use as your target than the ones I've used for the example above.
Maybe you
don't want a response curve that will extend all the way down into the sub-bass frequencies like the Harman curve, or the above 5128 plot, for example. And prefer to simulate something closer to a bookshelf speaker, or something like that. Or prefer to approximate a more linear in-room response, perhaps a bit more like the KEF Reference 5, or Kali IN-8v2 in one of my previous examples above. That is something you can also easily do using speaker sound power curves and HBK's DF curve as a general guide, if you so desire. The control on what to do on something like that is completely in your hands... if you want it to be.
")
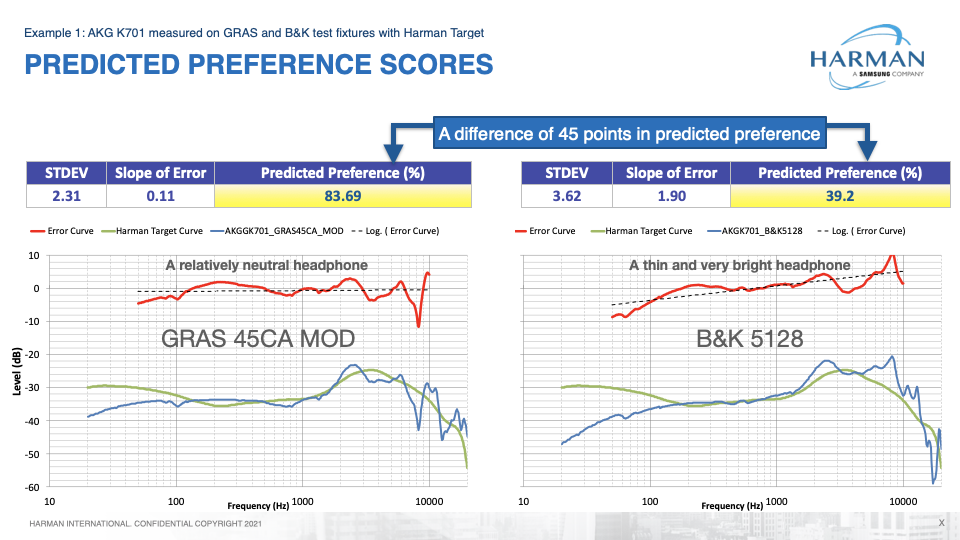
This is the difference between the diffuse field-derived 5128 target shown above, and
Harman's 2018 over-ear target for the GRAS rig, btw, in case anyone's interested in that...