General Headphone measurement related discussions
Dec 20, 2020 at 4:57 PM Post #46 of 94
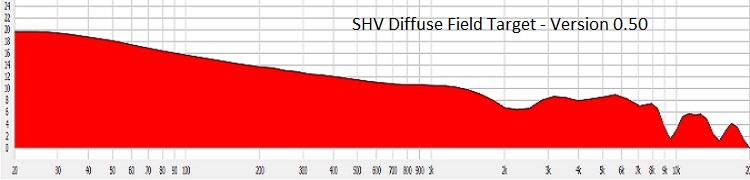
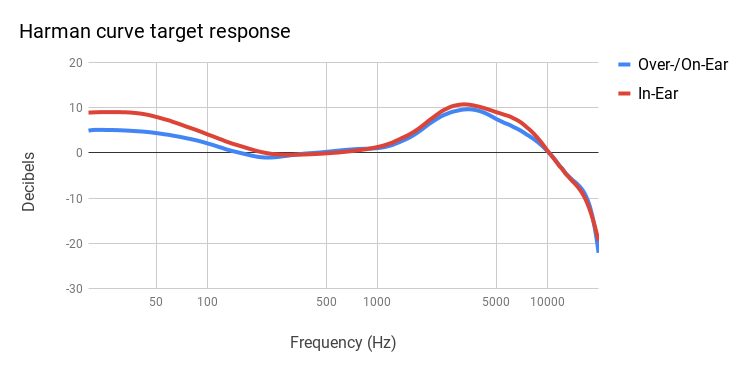
I don't know if you noticed this btw, but the target response curve that AutoEQ uses for its Rtings graphs looks a bit different in the treble than the target Rtings is currently using for its own compensated frequency plots.

I believe Jaakko computed his Rtings target by comparing the measurements of several headphones in both the Oratory1990 and Rtings databases. And then modifying the Harman target accordingly. A notable feature of the AutoEQ Rtings target is the rather pronounced peak at 9 kHz, which is almost as high as the peak at 3 kHz. That is a feature you will often see in the Rtings measurements. Though the height of that peak can vary quite a bit.

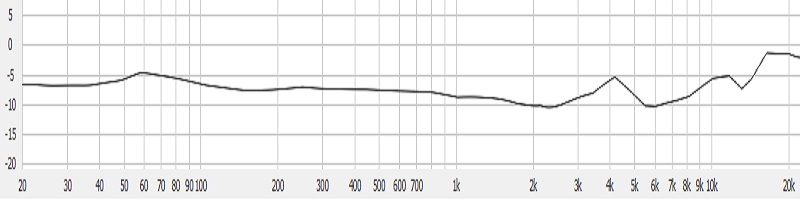
On my 250 ohm Beyer DT-770's, for example, the peak at 9k is several dBs higher than the AutoEQ target curve, which is shown in light blue...

https://github.com/jaakkopasanen/AutoEq/tree/master/results/rtings/rtings_harman_over-ear_2018/Beyerdynamic DT 770 250 Ohm

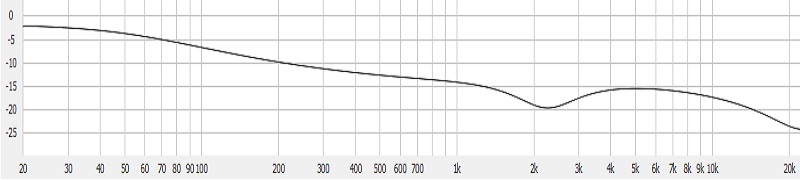
While on some of the more popular Sennheisers, it's several dBs lower than the AutoEQ target...

https://github.com/jaakkopasanen/AutoEq/tree/master/results/rtings/rtings_harman_over-ear_2018/Sennheiser HD 650
https://github.com/jaakkopasanen/AutoEq/tree/master/results/rtings/rtings_harman_over-ear_2018/Sennheiser HD 600
https://github.com/jaakkopasanen/AutoEq/tree/master/results/rtings/rtings_harman_over-ear_2018/Sennheiser HD 58X

It is a closer match though on a headphone like the AKG K371...

https://github.com/jaakkopasanen/AutoEq/tree/master/results/rtings/rtings_harman_over-ear_2018/AKG K371

The M40x is also not a bad match at that particular frequency, but it stays brighter above 9 kHz than the target. And is also a bit too withdrawn in the lower midrange...

https://github.com/jaakkopasanen/AutoEq/tree/master/results/rtings/rtings_harman_over-ear_2018/Audio-Technica ATH-M40x

Compare the response of the M40x to the Senn 58X above, which seems to follow the AutoEQ target better in the upper treble between 10 and 20 kHz.

I'm not sure a headphone needs to be quite as bright in that 9 kHz range as the AutoEQ Rtings target suggests, to sound good. But maybe the lack of volume in that general area is one of the things which contributes to some Sennheisers having a slightly "veiled" quality. I suspect that Sennheiser tuned some of their headphones that way intentionally, btw, to take a bit of the edge off of their sound in that frequency range.

The Shure SRH440 also follows that AutoEQ target pretty well in the treble and upper mids, including around 9k. So perhaps that's why Crinacle gave it such a high rank (for a lower cost HP) on his list of best headphones. The 440 is pretty rolled off in the bass for a closed HP though. And the peak at 3k appears slightly higher relative to the target curve than the peak at 3 kHz. So I suspect it might come across a little on the bright side....

https://github.com/jaakkopasanen/AutoEq/tree/master/results/rtings/rtings_harman_over-ear_2018/Shure SRH440

It looks maybe a little too forward in the upper mids between 1k and 2k as well. Which is an area where my ears seem to be particularly sensitive. But overall it's doin a fairly good job of tracking the AutoEQ curve, except in the lower bass.
 
Last edited:
Dec 20, 2020 at 5:48 PM Post #47 of 94
AutoEQ lowered the bass boost on its target response curves a couple dBs below the generic Harman curve btw. So keep that in mind as well.

So headphones which go a couple dBs above the AutoEQ targets in the bass, and to some extent in the lower mids may actually be a closer match to the generic Harman 2018 over-ear response curve than headphones which follow the AutoEQ target more precisely in those areas.
 
Last edited:
Dec 24, 2020 at 8:39 AM Post #48 of 94
Ok so I thought of something interesting that would give good insights to what the pinna does and what the canal does.

Is there a way to isolate the response of an avg ear canal to show how it effects a flat frequency sweep coming in?

Also, can the same be done with the Pinna? Isolate the reponse of the Pinna?

This would show the differences of iems and circumaural responses.

When I look at flat plate and pinna response, I wonder if I can just subtract the differences in responses to get the effect of the pinna?

I guess this is a question of what the auditory system expect as flat and it's flat is what it's used to with it's pinna and ear canal shape. So at the drum, the auditory system isn't expecting flat, but perhaps what the response that the canal, pinna, and head and torso causes from a flat sweep of a speaker?
 
Last edited:
Dec 24, 2020 at 6:37 PM Post #49 of 94
Ok so I thought of something interesting that would give good insights to what the pinna does and what the canal does.

Is there a way to isolate the response of an avg ear canal to show how it effects a flat frequency sweep coming in?

Also, can the same be done with the Pinna? Isolate the reponse of the Pinna?

This would show the differences of iems and circumaural responses.

When I look at flat plate and pinna response, I wonder if I can just subtract the differences in responses to get the effect of the pinna?

I guess this is a question of what the auditory system expect as flat and it's flat is what it's used to with it's pinna and ear canal shape. So at the drum, the auditory system isn't expecting flat, but perhaps what the response that the canal, pinna, and head and torso causes from a flat sweep of a speaker?

This is getting a little out of my depth. But the slide that Tyll uses in his presentations shows the contributions of different parts of the ear, and also the head, neck and torso. But not the room, in the case of a loudspeaker in a room...

Ear-resonance.jpg


Link: https://hearinghealthmatters.org/waynesworld/2014/human-ear-canal-viii/

These are most likely free-field measurements, taken with the sound source at a 45 degree angle to the head, as indicated above. How the different parts were separated out, I don't really know. There may be other ways of measuring that kind of stuff though.

The ear canal is the primary contributor to the main resonance at around 3 kHz (give or take). And will usually have overtones at approximately 3x and 5x that frequency as well. Based on the above chart, it is responsible for at least half of the total boost in amplitude at ~3 kHz in the upper midrange. There is also a fairly large boost from the concha (which is the smaller cavity of the outer ear) at around 5 to 6 kHz. And a relatively small contribution from the outer edges of the ear (pinna flange) at around 4 kHz.

If you want the total contribution of the outer ear from both the concha and pinna flange, then just add the values of those two curves together. The contribution from the pinna flange may be relatively small though on some over-ear headphones. With on-ear headphones, you'd probably only be getting some sound from the concha, and the ear canal. In addition to the boost at 5-6 kHz, the concha also appears to have a subtractive effect at a higher frequency, somewhere in the 10k range.

Also, the contributions from different parts of the ear may change depending on the angle of the sound source. And may look a bit different with the source at a 30 or 90 degree angle to the head.
 
Last edited:
Dec 24, 2020 at 9:10 PM Post #50 of 94
There is one other point I should try to clear up from the previous page, that I think I might have gotten a little confused on.

If the objective is to simulate the sound of speakers in a room, then imo, there should probably not be a huge difference in the final measurements at the eardrum, between the frequency response of the speakers, and a headphone, or an IEM. They should all look about the same when measured at the eardrum. At least theoretically.

The effects of different acoustic interactions with the room, and different parts of the body and ears would be applicable to the flat response of the speaker. Not to the measurements at the eardrum. (Unless you are trying to undo them.)

Not having thought about this subject that much, I think I may have gotten that slightly turned around before. So I apologize if that confused anyone.

If there are any differences in the preferred responses at the eardrum for different types of transducers, such as more bass, or less treble, etc., then those may be related to some other type of phenomena than the different acoustic interactions of the transducers prior to reaching the eardrum. And may have more to do with perceptual issues.

EDIT: See the video I just posted below on the new 5128 measuring standard for a possible physical and acoustic explanation for the differences in the measurements.
 
Last edited:
Dec 24, 2020 at 10:02 PM Post #51 of 94
Last edited:
Dec 24, 2020 at 10:26 PM Post #52 of 94
Mr. Toole had some interesting comments on the subject of hearing loss and loudspeaker sound preferences on the 2nd page of this 2016 article btw, which could be tangentially related to demographic differences in headphone frequency preferences...

https://www.audioholics.com/room-acoustics/room-reflections-human-adaptation
https://www.audioholics.com/room-ac...ons-human-adaptation/what-do-listeners-prefer

Based on some of my initial tests with different EQ settings on my DT-770, on some music at least, it seems as though my preferences are running a little bit on the warmer and bassier side of "neutral" with a bit less brightness in the upper midrange than either the generic Harman curve or my original target curve based on 19 neutralish headphones.

A somewhat extreme example of what I mean...

https://www.rtings.com/headphones/1-3-1/graph#313/3183
https://www.rtings.com/headphones/1-3-1/graph#313/3182

Current Harman over-ear curve for comparison...

EX_z4f1U8AA8V6_


It's still early days though. And I'm not sure that I'm performing my EQ corrections properly yet. So this may change. The generic Harman curve and other curves similar to it seem just a bit harsh and bright though in the upper mids with much of the (admittedly heavily DRC'd) music I often listen to. Particularly around the 1 and 2 kHz range. And I wonder if that could have something to do with the way its being authored.

The curve of the Bose Soundlink On-Ear headphone linked above looks somewhat similar to the bassier response curves on alot of IEMs, and more bassy (in measurements anyway) on-ear type headphones that alot of the younger folk seem to enjoy listening to. So maybe that's the reason. Not really sure about that though.

It is one possible theory though for the potential differences in my sound preferences. I prefer listening at somewhat lower volumes as well. So that could have something to do with it too.
 
Last edited:
Dec 24, 2020 at 11:14 PM Post #53 of 94
Dec 27, 2020 at 5:40 PM Post #54 of 94
Recent video posted by Jude on the new B&K 5128 standard.


So why I am posting this?... Well, because it touches on exactly some of the stuff we've been talking about above. Especially the differences in-ear versus over-ear measurements. As explained near the end, the new 5128 system does a better job of modeling what's actually going on inside the ear than the 711 systems currently being used. And it potentially helps to explain why graphs of IEMs made on the older 711 systems can look quite a bit more bassy than over-ear type headphones, while still sounding more or less similar to the listener.

It apparently has to do with the length and volume of the ear canals in the simulators.

More discussion on the above here...

https://www.head-fi.org/threads/presenting-at-the-hbk-hottinger-brüel-kjær-product-physics-conference.944117/
 
Last edited:
Jan 5, 2021 at 7:14 PM Post #55 of 94
So ironic most audiophiles are male.
I posted this in one of the threads and realized that the above are not audiograms, but normalized to 20 yr olds being normal. Perhaps it's normal if your body is at peak health at the age? No degradations? Or is it just sensitive at certain ranges then? It does make sense for mooor bass when young.

Also, why does female audio grams have much smoother curve than males that just takes a dive after a certain age?

Audiologist audiogram actually looks like this (look below). And we can see are large difference at the upper-mids area as we age, and for men, it drastically drops, and then the treble in general just drop like crazy. So, the sensitivity when young isn't actually linear, but a bit emphasized in the upper-mids, and then it just takes a dive after 30s or so. Hot damn!

So, if you're 20, 60 yr old headphone recommendation will not work.
The-average-pure-tone-audiogram-for-different-age-groups-by-decade-in-men-and-women.jpg
 
Last edited:
Jan 7, 2021 at 9:14 AM Post #56 of 94
You make some interesting and fair points, I think.

If hearing acuity was determinative though of tonal preference, then you'd think it would apply more across the board for all kinds of transducers, and not just headphones. You don't hear many of the experts supporting this point of view for loudspeakers though, beyond some different room treatments. And maybe adjustments for different listening conditions and levels.

The blind tests performed by Harman all seemed to reach the same conclusions, that speakers with an anechoically flat sound are best. Most of those tests were probably performed with subjects with "normal" hearing though, fwtw.

I have bad tinnitus in both my ears. And my hearing has clearly declined quite a bit with age, particularly in the higher frequencies. Maybe not as much as someone who works in a noisier field, like music or construction. But certainly enough to be noticeable in listening tests. And yet, I still seem to prefer headphones that are pretty close to or maybe a little warmer than a neutral sound. Or at least our best guess at approximately what that is.

Someone in the K371 topic made the point that hearing loss which is progressive is a bit different than that which is not, and more sudden. So there may be some form of adaptation over a longer period of time.

I also don't want to increase my hearing loss in the higher frequencies by listening to overly bright headphones, in some kind of attempt to counteract it. That is another reason why I am so passionate on the subject of what a neutral and transparent sound really is! I really, REALLY want an answer to that question. :)

The other reason that I am so passionate on this topic is that I want to hear the music as closely as possible to the way the artist intended.

Imo, the biggest hole in our knowledge on this is still a lack of good DRP measurements for speakers in a typical domestic listening space, for all of the headphone measurement rigs currently in use. More research is probably needed on the best ways to accomplish that. And perhaps we need some new standards for how the measurements should be done, like we currently (sort of) have for diffuse and free-field measurements. And Harman's spinorama for loudspeakers. But it is, imo, something which is completely within our capacity to do.
 
Last edited:
Jan 10, 2021 at 3:02 AM Post #57 of 94
Oratory got new ui for looking at his measurements, and it's fantastic! https://headphonedatabase.com/oratory

SilverEars,

After you posted the above link in the K361/371 topic, I decided to try a couple experiments. First I calculated the difference between Oratory's diffuse field curve and the 2018 Harman over-ear target. And that looked something like this...

HARMAN DIFFUSE FIELD DIFFERENCE.jpg


The main thing I was interested in was the approximate slope of this curve. So I could try to apply a similar correction to the diffuse field curve, for use as a possible new target response curve.

This is what the diffuse field curve looks like with a 1.5 dB per octave slope applied. The 2018 Harman target is also shown in gray for comparison...

DIFFUSE FIELD HALF DB SLOPE.jpg


The same diffuse field curve with a slightly less pronounced 1.2 dB per octave slope applied...

DIFFUSE FIELD PT4 DB SLOPE.jpg


A headphone with frequency response similar to either of the above would look more or less like a straight diagonal line on Oratory's compensated diffuse field plots.

Slopes used to create the above curves. Green = 1.5 dB per octave. Orange = 1.2 dB per octave...

HARMAN DIFFUSE FIELD DIFFERENCE PLUS SLOPES.jpg


The corrected diffuse field curves above are both pretty similar in shape to the original Olive-Welti curve...

OLIVE-WELTI.jpg
 
Last edited:
Jan 13, 2021 at 6:06 PM Post #58 of 94
A couple updated plots related to the above. As indicated, this is a plot of the 2018 Harman over-ear headphone curve with diffuse field compensation, and a 1.3 dB per octave slope for comparison...

HARMAN AND 1-3 SLOPE DIFFUSE FIELD.jpg


1.3 dBs per octave is the average slope of all the white points highlighted above, relative to the yellow point at 630 Hz in the center of the Harman curve, which is in the middle of the 10-octave 20 Hz to 20 kHz frequency range shown.

The points are spaced at 1/3 octave intervals. And I deliberately omitted a couple points at 16 and 20 kHz in the high treble, because I felt those might compromise the accuracy in the rest of the curve a bit, where the overall response is more linear. Including one, or both of those points would make the average slope a bit steeper and darker though. So I may rethink that.

For the record, the average slope with the point at 16 kHz included is about 1.34 dB per octave. So a range between about 1.3 and 1.35 dBs per octave would not be unreasonable.

The same 1.3 dB per octave diffuse field slope shown with, and also without diffuse field compensation, compared to the Harman curve...

1-3 DIFFUSE FIELD SLOPE - DIFFUSE AND RAW.jpg


I haven't had a chance to try equalizing my headphones to match the above curve yet to see how it actually sounds. But as a rough shorthand approximation, it doesn't look too bad (imo). The one area where it diverges rather significantly from the Harman curve is in the high treble.

The diffuse field plot of the Harman curve is also slightly "smiley" though, with a little more emphasis in the bass and low treble than in the middle frequencies. So it's probably better approximated on a diffuse field plot by a diagonal line with a modest depression in the center. And I'm working on a couple examples of that as well. Calculating an appropriate curve is a little more involved though, and takes a bit more work than a slope of constant value.

One slight downside to using a slightly smiley curve is that it will potentially diverge a bit more from the Harman curve in the highest frequencies (above about 10 kHz) than a constant slope.
 
Last edited:
Jan 15, 2021 at 12:56 AM Post #59 of 94
Some headphones that appear to have pretty good bass...

https://headphonedatabase.com/oratory?ids=36,11

DIFFUSE FIELD COMPENSATED:

BASS DIFFUSE COMPENSATED.jpg


HARMAN COMPENSATED:

BASS HARMAN COMPENSATED.jpg


RAW:

BASS RAW.jpg


Note that I have increased the scale in the vertical access on all the above (but especially the two compensated plots) to better show how they deviate from the target compensation curves
 
Last edited:
Jan 15, 2021 at 1:26 AM Post #60 of 94
Some headphones with a pretty neutral response...

https://headphonedatabase.com/oratory?ids=56,11,188,226,231

Interesting to also see how these deviate slightly from the 2018 Harman target on a compensated plot. This plot is also scaled in the vertical axis to magnify the differences between the headphones and the Harman target btw...

HARMAN COMPENSATED:

NEUTRAL HARMAN COMPENSATED.jpg


DIFFUSE COMPENSATED:

NEUTRAL DIFFUSE COMPENSATED.jpg


You can only display up to 5 headphones at a time btw with Oratory's new graph tool. So you'll need to delete one of the above from the list, such as the Senn 580, to compare the above headphones to another headphone of your choice.

As a group, these have a pretty linear response in the midrange and treble on the diffuse plot. The AirPods Max drops down a little low though in a few spots in the low treble. And the AKG K371 is conversely one of the brighter HPs in approximately the same range in the low treble.

Overall, I tend to trust the diffuse field plots more than the Harman compensated plots. Both target curves appear to need a little adjustment though in a few spots, to fix a few of the anomalies, such as the slight wiggle in the 2k to 4k range.
 
Last edited:

Users who are viewing this thread

Back
Top