crinacle's IEM FR measurement database
Dec 31, 2016 at 11:39 PM Post #31 of 1,335
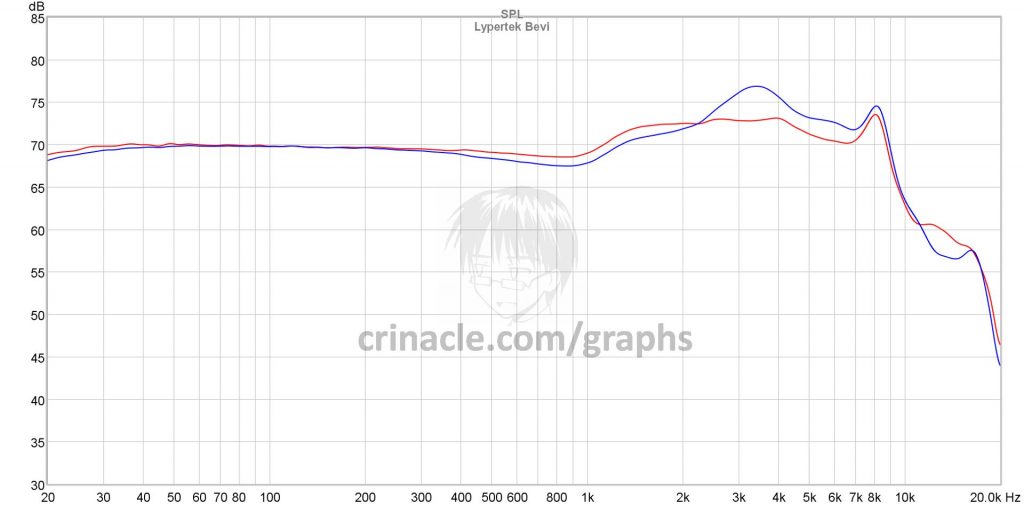
IT03 R Channel measurement with FFT Plot app.

 
The normalization looks good. Good job! This is just me being a little anal, but could you redo it with a mixed graph and longer average? Seems a tad rough.
 
Also, really interested in a FFT Plot curve of the Jomo 6R. Planning to get one myself.
 
Jan 1, 2017 at 12:11 AM Post #32 of 1,335
The normalization looks good. Good job! This is just me being a little anal, but could you redo it with a mixed graph and longer average? Seems a tad rough.

Also, really interested in a FFT Plot curve of the Jomo 6R. Planning to get one myself.


My curves with AudioTools look smoother. I think it's because I can load my IMM06 calibration file with AudioTools. I haven't found a way to do that with FFT Plot. I let it run for 60 seconds, and it looks much tougher than what is very out of AudioTools with 20 seconds. And I tried mixed graph anyway. It just makes the upper end look fuzzy. Not convinced FFT Plot is the way to go until they add in more features...
 
Jan 1, 2017 at 12:35 AM Post #33 of 1,335
 
My curves with AudioTools look smoother. I think it's because I can load my IMM06 calibration file with AudioTools. I haven't found a way to do that with FFT Plot. I let it run for 60 seconds, and it looks much tougher than what is very out of AudioTools with 20 seconds. And I tried mixed graph anyway. It just makes the upper end look fuzzy. Not convinced FFT Plot is the way to go until they add in more features...

 
Spectrum Analyzer by Onyx has the same interface as FFT Plot (same dev) but also comes with a calibration function. Maybe you can try that?
 
I think you're just not running it long enough. Some of my longer averaged graphs look dead smooth.
 
EDIT: Your initial curve was pretty dead-on smooth too.
 
Jan 1, 2017 at 12:52 AM Post #34 of 1,335
Spectrum Analyzer by Onyx has the same interface as FFT Plot (same dev) but also comes with a calibration function. Maybe you can try that?

I think you're just not running it long enough. Some of my longer averaged graphs look dead smooth.

EDIT: Your initial curve was pretty dead-on smooth too.


My first one was smooth because I chose to record fewer points along the curve. When I chose the maximum, it got very jittery. In fact, I was surprised when you told me you were using maximum resolution. In my initial run, it looked just like my most recent one.

When you look over my AudioTools measurements, you can see a big difference in smoothness even though I'm using the same resolution with both apps. I'll try Spectrum Analyzer. I think calibration is more necessary for my IMM06 than it is for yours, lol!
 
Jan 1, 2017 at 12:57 AM Post #36 of 1,335
My first one was smooth because I chose to record fewer points along the curve. When I chose the maximum, it got very jittery. In fact, I was surprised when you told me you were using maximum resolution. In my initial run, it looked just like my most recent one.

When you look over my AudioTools measurements, you can see a big difference in smoothness even though I'm using the same resolution with both apps. I'll try Spectrum Analyzer. I think calibration is more necessary for my IMM06 than it is for yours, lol!

 
Jitter is mostly a smoothing issue though, which should be easily resolved with a higher average. That's my guess at least.
 
Do you still have the 6R with you?
 
Jan 1, 2017 at 7:08 PM Post #38 of 1,335
crinacle: I remeasured the IT03 in Spectrum Analyzer with my IMM06's calibration file applied, with White Noise from Spectrum Analyzer's tone generator, mic sensitivity set to 0.4, and measuring for 2 minutes. This looks better to me. I updated my original post with the newer, less jittery FFT Plot.

 
Jan 1, 2017 at 7:18 PM Post #39 of 1,335
crinacle: I remeasured the IT03 in Spectrum Analyzer with my IMM06's calibration file applied, with White Noise from Spectrum Analyzer's tone generator, mic sensitivity set to 0.4, and measuring for 2 minutes. This looks better to me. I updated my original post with the newer, less jittery FFT Plot.


8.5k peak should be nice for highs.peak between 5 and 6 should be gorgeous with female upper harmonics and violins, and the other bump between 1 and 2k should be nice for both male and female vocals...
IBasso probably did their homework!
 
Jan 1, 2017 at 7:23 PM Post #41 of 1,335
Did you mean to write something 1TrickPony?


Nice to see you with your own set of graphs man. Btw, I might consider the Shanling M3 sale...unless you know of something else that I should hold off for instead.
 
Jan 1, 2017 at 7:26 PM Post #42 of 1,335
Nice to see you with your own set of graphs man. Btw, I might consider the Shanling M3 sale...unless you know of something else that I should hold off for instead.


Yeah, I'm glad crinacle opened this thread up. I've been hesitant to put graphs up, but what the heck :wink:

M3 is a great DAP at the current price. I haven't heard of any M3 revision, but who knows. If you could find a used M5 for around the same price, I'd say to go for that, though.


Off to measure Jomo 6R...
 

Users who are viewing this thread

Back
Top