crinacle's IEM FR measurement database
Jan 31, 2017 at 4:36 PM Post #151 of 1,335
Very interesting thread everybody. I'm always impressed by the ingenuity of the folks in this community :)

The major problem seems to be the (in)ability to compare measurements made on different rigs, using different drivers, software, etc. I know there are a zillion uncertainties, including how the IEMs are inserted in the coupler (something none of us can probably every exactly replicate). I want to start with a more basic question though. Do you folks know what is on your y axis? I see most FR graphs with the y-axis labeled as "SPL" - and I've committed the same sin, but this is horribly ambiguous. I asked this question on another forum, but so far haven't had any feedback on this issue. 

If you don't apply any type of octave-band smoothing, I presume (I would hope) that the Y axis values are actually power spectral density, i.e., dB/Hz. Because if not, the amplitude from your FFT is going to depend on your sample rate and/or sample length. In other words, you could make the exact same measurement again with a different sampling rate and get a different answer - from the exact same IEM/coupler, without even moving anything. I saw mention earlier in this thread of a "decale" smoothing. Can anybody explain what that is? I've never heard of that before. Even if one wants to apply a 'standard' smoothing, like 1/nth octave, technically one still needs to agree on the pass-band edge frequencies first (perhaps less critical if n is large, i.e., 24 or 48). BTW, I've been using REW and have been unable to confirm what its non-smoothed data output corresponds to. If it's described in the REW user manual, I've not been able to find it. However, the ARTA manual does discuss this, starting on page 35, including how it does its octave bin resampling:


I think what's needed  - at least as a starting point - is to figure out if we're actually putting the same thing on all our respective y-axes. Do you folks know exactly what output all these various iOS apps are creating?


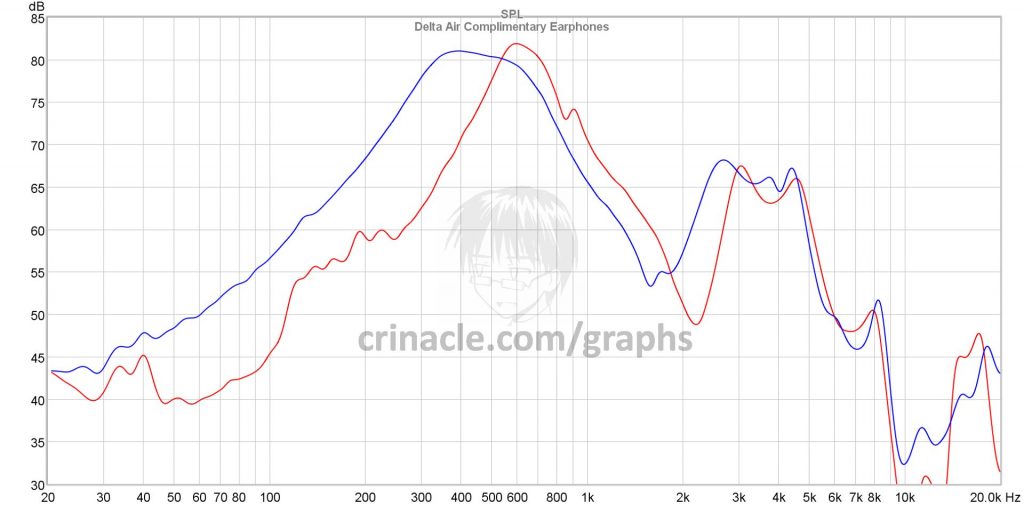
In my case, AudioTool (Android) does not have the option to change sample rate. I'm stuck @44100hz, which makes my high frequencies look very spiky and inaccurate. (e.g 10000hz has only 4.41 samples, meanwhile 100hz has 441 samples, by logic)
While it helps with accuracy, it doesn't change all that much (accounting for the prediction and calculation of each app)

The smoothing part is pretty much the wild-card here. As far as my understanding goes, smoothing is used to compensate for noise and outside reflection. I always use atleast 1/12th octave smoothing, as anything above gets too inaccurate. So there is an obvious trade-off. We are using very basic measuring systems, hence dealing with such errors is to be expected.

My case with bass-roll is similar to what crinacle posted above. I tried to compensate manually, but I got inconsistent values. SPL = dB, for me.


(My measurement of the LZ A4)

Please correct me, if I am wrong.
 
Jan 31, 2017 at 5:11 PM Post #152 of 1,335
csglinux In most cases labeling the y-axis with "SPL" will be wrong. The system will need to be calibrated first to measure absolute levels.

As far as I know different sample rates will not change the amplitude. If the sample rate changes, different integration constants will be used that are equal to the duration of the FFT blocks.
 
Feb 1, 2017 at 12:16 AM Post #153 of 1,335
getting the loudness at 1khz is something people should try to know, it has at least the very basic purpose of not blowing up a sensitive IEM by mistake some day. but after that, SPL values, smoothing or sample rate do not really matter because we won't achieve professional measurements with donkey gear. so long as the same settings are used on all the measurements done by one guy, we can strive for consistency within our own graphs. which is really the only thing we should try to do here.
trying to match other people's measurements is IMO a mistake. the ideas of controlled variable and consistency, so precious to measurements, fall "a little short" when 100% of the conditions are different
rolleyes.gif
: different pair of IEM measured on a different measurement rig by someone else with his own method and own calibration.
 
in practice we often can't even claim to achieve consistency within our own graphs, because sealed IEMs vs open back often won't measure the way they sound to our ears. and we're supposed to try and get the IEMs at the same distance from the coupler, to kind of mimic the average ear canal resonance. but in many cases it's not relevant for real life use. do we insert a shure IEM as deep as an etymotic? of course not. and of course tips is a massive uncertainty, half the time you won't even know which one was used for the measurement, if any at all for manufacturer graphs.
so my advice is don't sweat the small stuff and be happy if you can find a method that gives more or less the same graph each time you put the same IEM in the tube.  getting a grip on variations is where we can find meaning for our graphs, and variations don't really need a proper reference unit. call it dbSPL or dbSpartacus, as long as the variation is 5db at 2khz between IEM A and IEM B on the same gear, we know what we needed to know.
 
Feb 1, 2017 at 1:16 AM Post #154 of 1,335
I'm going to agree with @bartsky here and take a somewhat contrary view to my friend with the cool python-inspired name :wink: Sampling rate and sample length are very, very important - unless we're actually plotting dB/Hz and using the same delta-f frequency bins; then we'll get the same levels on the y axis regardless. We're taking our FFT amplitude output, p, and computing: 10.log(p^2/p_ref^2), where p_ref is your typical 20 microPa. p^2 = power and power goes up the more signal history you have, and the FFT creates more frequency bins as you increase the sample rate for a given fixed time interval. So, as @bartsky says we need to have some multipliers in our FFTs to account for that - one of which should have units of time (1/frequency). So, @FUYU, I believe (at least, sincerely hope) that your units are really dB/Hz. ARTA does this. REW appears to, but I haven't been able to confirm this 100%. I'd be cautious of any piece of software that didn't tell me exactly what it was plotting.

I agree with all the other comments about how difficult this is and all the many things that could go wrong or be inconsistent from measurement to measurement, but if we're not plotting the same consistent output, there's zero hope of ever comparing measurements. Worse - it would be wrong (prone to other errors) to take a calibration file from another measurement that didn't conform to the same output. IMHO, anyway :)

I've not tried these iOS or Android apps. It's a cool idea to simply hit the IEM with white noise. However, I bet it matters how that white noise is generated. I don't know if a random number generator would create a smooth enough distribution of power over all frequencies. I suspect that would be the one weakness of this method (compared with a controlled chirp or log- f sweep). That might be why there are some oscillations in the FFT output at the highest frequencies. Are there no iOS or Android apps out there that can do frequency sweeps? BTW, does anybody know if AudioTool (for Android) is basically the same as AudioTools (for iOS)? If so, it seems the Android version is less than half the price.
 
Feb 1, 2017 at 3:22 AM Post #155 of 1,335
just to be clear when you say "we", you're looking for consistency between users, or only consistency for the measurements done by one person?  the former is too much effort for something that will still be of poor reliability anyway. if it's the latter, why would someone go change his setting all the time?


Feb 1, 2017 at 7:06 AM Post #156 of 1,335
And the award for highest extending IEM goes to...
 
Advanced AcousticWerkes W900 (raw/compensated)


Well pack it up boys. Looks like AAW's outrageous claims were true.
 
Feb 1, 2017 at 8:36 AM Post #158 of 1,335
just to be clear when you say "we", you're looking for consistency between users, or only consistency for the measurements done by one person?  the former is too much effort for something that will still be of poor reliability anyway. if it's the latter, why would someone go change his setting all the time?


If you (or I, or we) are ever going make comparisons, we'd better make sure we're comparing the same thing. I'm not saying it would be easy for us both to get identical measurements from our VV couplers, but we should be able to get close. The fundamental prerequisite for that is for us both to be using the same units. It's not going to work out (even if you were only using my measurements as a one-off calibration/correction) if your graph is in Celcius and mine is in Farenheit. One hurdle at a time... :wink:

P.S. You're also using REW, right? I'll pm you a list of my current IEMs and if we have one in common, maybe we can take a crack at this. I bet we can get close - just starting with the raw measurements. Want to try??
 
Feb 1, 2017 at 10:35 AM Post #159 of 1,335
@castleofargh Is the consistency your Veritas achieves that bad? If I measure an IEM and repeat it a few days later I nearly get exactly the same reading. The deviation between measurements is at least much smaller than between the right and left channel.

no that's pretty much the one thing I learned to do correctly (as long as I remember which tip I used
tongue.gif
). my slightly fatalistic views concern IEM to IEM, or the graph vs what is really happening in someone's ear, or my measurements vs someone else's.
 
 
Quote:
 
just to be clear when you say "we", you're looking for consistency between users, or only consistency for the measurements done by one person?  the former is too much effort for something that will still be of poor reliability anyway. if it's the latter, why would someone go change his setting all the time?


If you (or I, or we) are ever going make comparisons, we'd better make sure we're comparing the same thing. I'm not saying it would be easy for us both to get identical measurements from our VV couplers, but we should be able to get close. The fundamental prerequisite for that is for us both to be using the same units. It's not going to work out (even if you were only using my measurements as a one-off calibration/correction) if your graph is in Celcius and mine is in Farenheit. One hurdle at a time... :wink:

P.S. You're also using REW, right? I'll pm you a list of my current IEMs and if we have one in common, maybe we can take a crack at this. I bet we can get close - just starting with the raw measurements. Want to try??

I remember annoying Brooko and a few others on this very matter, and like 20 other subjects back when the veritas came out. it started with the failed calibration files for the coupler and went downhill from there. soon enough they all ran away, too scared to get killed of boredom 

from all my badly explained ideas about calibration and my persistence to use REW when they all used ARTA(I still don't get why, but then again I'm EQ obsessed so REW is a no brainer for me). 
 
now my problem is that I've done a good deal of measurements in a way that isn't ideal (for one I don't really respect whatever standard for the distance to the coupler so I'm sure to have a different resonance from the sealed volume). and most of the time I just try to insert to whatever depth that seems to match what I'm hearing when I use them(up to 8 or 10khz, I don't bother with higher freqs on headphone graphs). it's a mainly egoistical use, I don't publish much unless asked for it.
so anything that requires more than changing a calibration file, would mean that I must give up what I've done so far and start anew. right now I'm not overjoyed by the idea TBH.
 
but the IMM-6, comes with a calibration. even if it's for room measurements so it's meaningless as far as actual calibration is concerned with IEMs, at least it's already a basis for similarity between IMM-6 units so that's pretty good. aside from agreeing on using the same tube,  the same tips, and making measurements at the same distance from the mic, getting "close enough" results shouldn't be too hard.
 
Feb 1, 2017 at 10:42 AM Post #161 of 1,335
@crinacle Just wanted to check in, any chance to measure the Galaxy v2?

 
Doesn't look like it. I'll be leaving the country in a few days and there doesn't seem to be any sign of shops about to receive V2 demo units. Friend also sold his off so that's a no-go.
 
Feb 5, 2017 at 8:22 AM Post #162 of 1,335
Many of you have been waiting for this update...


Observations:
 
  1. Earsonics measures rather badly. SM64v2 wasn't that bad, but the S-EM6 sounded horrible and disjointed, no sugarcoating it.
  2. Andromeda, with all the hype, meets expectations. No surprise there.
  3. Prophile-8 is in my top 10 IEMs now. Extremely clean sounding IEM that doesn't stray into coldness, excellent bass and dripping with detail.
 
Feb 5, 2017 at 8:44 AM Post #163 of 1,335
Some choice comparisons to test out my new compensation curve:
 
Andromeda: against Ken Ball's

 
Vega: against Ken Ball's

 
Jupiter: against Ken Ball's


Prophile-8: against headflux

 
I think I'm rather happy with what I got now. Perhaps a little insensitivity between 8K and 10K but doesn't seem like it can be solved with compensation.
 
Feb 5, 2017 at 10:52 AM Post #164 of 1,335
Nice! It's probaly the best you could achieve given the limitations of your coupler, smartphone and app. IMO the results give a fairly good idea how a "real" measurement would look like. Let's not forget that your setup is extremely mobile and low cost, so that's very good achievement IMO.

Have you ever thought of only recording raw data on the go and later export it to Arta or REW? That would give you better possibilities for smoothing, scaling, compensating and so on.

Btw: It seems like Ken Ball's measurements aren't real measurements. The look like they were drawings based on real measurements.
 
Feb 5, 2017 at 2:40 PM Post #165 of 1,335
Kens are real measurements - he's posted the actual graphs. He also gave me the data files so that I could calculate a compensation curve for my veritas. When I get to my own PC I can send a link
 

Users who are viewing this thread

Back
Top