Building a Headphone Measurement Lab
Apr 26, 2010 at 12:46 AM Post #106 of 355
Quote:

Originally Posted by Tyll Hertsens /img/forum/go_quote.gif
Again, this is exactly why I'll be taking 5 FR measurements and averaging them: to see if the noise in the highs can be reduced to give an accurate measure of response up there.


Ah ok, so the graphs in the PDF don't come from five measurements then (just from one, we can assume.)

Still, I think one case to clarify would be how big the differences between left and right drivers, even after five measurements and averaging, would need to be to suggest that the best course of action might be to try repeating the measurements with another headphone of same model.
 
Apr 26, 2010 at 12:52 AM Post #107 of 355
Quote:

Originally Posted by Tyll Hertsens /img/forum/go_quote.gif
844960701_mnLpi-M.jpg


You know what might be cool? This is something to maybe consider for the future. An animation, showing simultaneously the changes in the position of the headphone on the dummy head on one side, and the changes in the response on the other side. This would take a lot of measurements though, maybe just five measurements wouldn't result in a good enough animation showing how things change with positioning.
 
Apr 26, 2010 at 1:06 AM Post #108 of 355
Quote:

Originally Posted by rsaavedra /img/forum/go_quote.gif
You know what might be cool?


I'm way ahead of ya.


Basically, you can see all this stuff by looking at the square wave, real time, to tell what's going on.
deal.gif


I'm gonna make a little video of that tomorrow.

Can you tell me what you can see looking at the square waves?


Norton.gif
 
Apr 26, 2010 at 1:09 AM Post #109 of 355
Quote:

Originally Posted by Tyll Hertsens /img/forum/go_quote.gif
Again, this is exactly why I'll be taking 5 FR measurements and averaging them: to see if the noise in the highs can be reduced to give an accurate measure of response up there.


Yet another comment on that same post of your Tyll. I still wonder if a second repositioning of a headphone, let's say the HD650, exactly on the position that yielded such a drop in the upper treble, would result in the same drop or similar enough.

What I'm aiming at is a matter of statistical accuracy within a specific positioning of the headphone.

Allow me to elaborate a little.

Using the same signals, and same source and amplification and cables, with the same headphones, and at the same position on the dummy head, with the same microphones in that dummy head, and with the same measurement equipment, should allow you to gather several measurements for a specific headphone and position on the head. Those measurements should in principle be extremely similar, but because of minor differences in positioning, they won't be exactly identical, particularly in the treble regions, as you point out. But that's what needs further study, because the magnitude of those differences (within one specific positioning) would allow to determine the standard deviation of your measurements.

If you replicate the positioning, but the measurements at certain frequencies appear inconsistent enough (e.g. too large a standard deviation for specific frequencies, after enough measurements are taken for that same position of the headphone), then what this will tell you is that five measurements at different positions maybe won't be enough, or that your positioning is or isn't accurate enough to gather the high freq. response accurately enough. Maybe you'd better use more than one measurement per position, or way more than five measurements in total. On the contrary, the deviation analysis might suggest that five measurements is overkill --even though from what you have said about responses at high frequencies moving all over the place with minor changes in position, I doubt it.

I think to really make your measurements as solid as possible, you might want to consider getting a statistician on board, to check on the deviations of the measurements on the high frequency ranges. But again, the deviation not between the different five positions you are using for each headphone, but for actually several measurements taken with the same headphone on the same position, removing the headphones and then placing them on the head again each time, in principle on that same position. This will help determine whether the positioning is replicated with sufficient accuracy, and whether one single measurement per position is really reliable and good enough.


PS. Please notice this post was edited a few times, so there are corrections/additions after the first version.
Latest modifications: bolds for emphasis.
 
Apr 26, 2010 at 1:19 AM Post #110 of 355
Quote:

Originally Posted by Tyll Hertsens /img/forum/go_quote.gif
Basically, you can see all this stuff by looking at the square wave, real time, to tell what's going on.
deal.gif


Please explain what you mean. (I don't really follow at all in which way the information in the square wave chart is similar to seeing an animation of how the response changes when you change the position of the headphone on the dummy head.)
 
Apr 26, 2010 at 3:48 AM Post #111 of 355
Quote:

Originally Posted by rsaavedra /img/forum/go_quote.gif
I don't really follow at all in which way


I know ... isn't it exiting?


lurker.gif
 
Apr 26, 2010 at 4:03 AM Post #112 of 355
Quote:

Originally Posted by Tyll Hertsens /img/forum/go_quote.gif
I know ... isn't it exiting?


If I can make a guess, your microphones in your testing rig measure while you are playing a square wave through the headphones on the dummy head, then you move the headphones even so slightly on the dummy head, and you might see and film your osciloscope showing how the square wave "heard" by the microphones in the dummy head changes in shape correspondingly.

Yet, a shape-change in the measured square wave won't provide the same information a full FR's graph animated and associated to the exact position of the headphones could provide.

For example, when does the 10-20 kHz range goes lowest, when moving the headphones forward or when moving them down? How the overall emphasis between upper and lower treble changes when shifting the headphones from centered right on the ear canal, vs. moving them forward and down; or stricktly forward; or stricktly backward? And what's the magnitude of that change depending on how far from the dead-on center position the headphones are moved? None of this can be answered by inspecting the square wave video, can it?
 
Apr 26, 2010 at 10:52 PM Post #113 of 355
Quote:

Originally Posted by rsaavedra /img/forum/go_quote.gif
Yet, a shape-change in the measured square wave won't provide the same information a full FR's graph animated and associated to the exact position of the headphones could provide.


No, but you can tell if the lows are good based on how flat and horizontal the square wave is, and you can sort of tell how coherent the highs are by how regular the wiggles are.

I think we should start by looking at a square wave itself. I made a little spreadsheet that shows you how they work.


Here's some better images of the screen as I go through the movie.

Normal Squarewave.

848718398_rKDvi-L.jpg


If you don't have the right amplitude relationship, your square wave gets distorted.

A little too much contribution of harmonics.

848718152_YvvYZ-L.jpg


And way more harmonics.

848718760_BJ4Yg-L.jpg


You can also have too little contribution of harmonics.

848718683_VkbYh-L.jpg


Or much too little, and it starts to look really rounded off.

848718599_Esyy5-L.jpg


Then, we can go back to the correct relationship of harmonics in amplitude, but a shifting in time, or phase.

848718325_wnNb5-L.jpg


Phase shifts occur because high frequency sounds can be capacitively coupled, and therefor begin to advance in time.

Here's an even bigger phase shift.

848718254_F2yTa-L.jpg


And you can also have shifts of both phase and amplitude.

848718550_qfoX9-L.jpg


More.

848718464_WRc4k-L.jpg


So here's a couple of flicks of me putting T1s and K7011s on the head, while looking at the square wave.


Quite a bit of information there. Feel free to ask questions.
 
Apr 27, 2010 at 12:53 AM Post #114 of 355
This is awesome. Tyll, when you start getting your hands on all the phones without Headroom graphs, you are going to change lives. And I'm only exaggerating a little.

You need to get your hands on an HF2. I really want to see their graph. Everyone calls them dark, but to my ears they're brighter than my SR60s. And I, like many have posted before, really want to see some STAX!
 
Apr 27, 2010 at 2:01 AM Post #115 of 355
That was very informative and educational Tyll, thanks a lot.

I had to look up a link I had bookmarked a while ago to check the interpretation of square wave graphs, and no surprise, it matches your explanations. Also googled a few newer ones:

http://www.kennethkuhn.com/students/...ve_testing.pdf
What gives with this square wave? - diyAudio
Interpretation of Square wave response - AnandTech Forums

This one of yours in this thread might take the cake on Google searches very soon.


Yet, Stereophile, for example, hardly ever uses square wave analysis to measure/compare speakers. They do use them to measure and compare amplifiers, but not drivers in general. For drivers they use Frequency Response, of course, and Impedance, Spectral decay, Impulse response, and some times some other graphs. But not square wave analysis in general. I know measuring speakers is not the same as headphones, but I wonder why you are taking this route full force with headphones.

Besides allowing you to compare the level of ringing, square wave analysis (correct if I'm wrong) won't help much in comparing the upper frequency responses accurately, in particular, it's relationship in terms of relative emphasis with respect to the rest of the spectrum, or for example upper vs. lower treble. For that we have the well known and plain ol' FR graphs.

And speaking of high frequencies, I don't think playing with the square wave in advance will help replicate a consistent positioning for replicating a specific treble response. If the aim is to reproduce a specific treble response already observed, I don't think attempting to get a similar square wave will beat simply trying to accurately place the headphone exactly on the same spot. That in itself would require some solid study, to show that square wave analysis can really help find a specific treble response measured earlier in a headphone.

So my main questions remain unanswered, I think you haven't addressed them yet. So won't add new questions, just the same ones:

- Do you know how treble-wise accurately you can reproduce the positioning of the headphones on the dummy head? Or in other words, do you know the standard deviation or variance you can get in your treble measurements when repeating measurements for a specific positioning of the headphones on the dummy head?

- How exactly do you determine the five different headphone positions you choose to gather FR measurements from?

PS. Once again, post edited a few times, make sure you checked the latest version.
 
Apr 27, 2010 at 2:32 AM Post #116 of 355
Thanks for the great questions reiterated, mang.
thumb.gif


Take your headphones and play around with them in different positions on your ears.

My experiences is that they do change a bit, but they remain characteristically basically the same.
How positionally sensitive is it to put headphones on your head?
(Let me be the first to say I think it actually makes a pretty good difference,
but psychoacoustically we know how to look past that stuff without noticing.)
Anyway, I think you san sense how much energy the cans are putting out,
even if it gets notched out sometimes.

I also think that it's pretty hard to get the position wrong on a lot of headphones
'cuz you just can't move them much before they run into the ear.
Lately, I've been thinking the best way is to place them most comfortably on the head---
you can see and feel pretty well where the headphones are designed to sit---
and then just do that five times and average out the differences.

I've also got to say, that that's what's in the spec.
It's a good guess that the guys that came up with it are pretty smart too.

Anyway, manufactures know that most users won't put them on with that kind of precision repeatably,
so they should be designed to be somewhat tolerant of placement.


Thanks for the kudos on the square wave thing, I love that kind of stuff.

I used to make excel charts that looked like spirograph drawings.
 
Apr 27, 2010 at 2:43 AM Post #117 of 355
Quote:

Originally Posted by Tyll Hertsens /img/forum/go_quote.gif
My experiences is that they do change a bit, but they remain characteristically basically the same.


Well, that's my same experience. In all fairness, that might certainly be so because lots of music doesn't have upper most treble, and also, many of us can't hear above 16 kHz already. But I'm refering to measured differences in treble, not our perceived differences.

I know I'm nagging too much about this, but I think to achieve the quality measurements we all want for headphones, it is critical to be aware of whether treble measurements are fair to be used for headphone comparisons, and what to do about them if they can be improved, so that we can get better and more informative comparisons.

Treble is known to go beserk with each little tiny movement of the headphone on the dummy head, you've said it yourself, Tyll. Some frequencies between 10 (maybe lower) and 20 kHz shoot up into the sky while others dissapear almost completely. You try to measure the headphone again, and you get a different type of wilderness up there in the treble. Other frequencies in that same range (10-20 kHz) now shoot up into the sky, while newer ones almost dissapear.

So, I do think my questions still remain unaddressed. The 1st one with respect to measurements, not with respect to our perceptions. The 2nd hasn't been addressed at all.

PS. In the spirit of scientific repeatability, it is important that the methodology used is transparent and well understood, so that anyone with interest and resources can in principle achieve similar results as the ones you'll get, if they follow the same methodology. Repeatability means reliability.
 
Apr 27, 2010 at 3:00 AM Post #118 of 355
Quote:

Originally Posted by rsaavedra /img/forum/go_quote.gif
Well, that's my same experience. In all fairness, that might certainly be so because lots of music doesn't have upper most treble, and also, many of us can't hear above 16 kHz already.


ImaPoser.gif


Figgen producers ... and old age!

bluduh.gif


Quote:

I know I'm nagging too much about this,


Neah, I don't mind really, you're right this stuff has to be clear as a bell.

Lemme think about your question some more, and I've got to write the routine that takes all the measurements, and the spread sheet to organize and display the data. I'm hoping to have that done prolly day after tomorrow.

Maybe I should do some measurements of how repeatably I can place the headphones; and how repeatably I can get a good mix of highs on the FR graphs.

Also, one of the things I've noticed is that, like all resonant responses, it tends to go back up if it goes down. So when the highs wiggle around like that, by smoothing you can average out the peaks and valley and probably come out at about where reality is.

We'll find out in a coupla days.
 
Apr 27, 2010 at 3:30 AM Post #119 of 355
Quote:

Originally Posted by Tyll Hertsens /img/forum/go_quote.gif
Neah, I don't mind really, you're right this stuff has to be clear as a bell.


Gee, glad to read that
smily_headphones1.gif
I really appreciate your patience and being understanding, Tyll.
 
Apr 27, 2010 at 5:55 PM Post #120 of 355
Nice work Tyll.

However I still don't really know what to make of square waves.
There are a couple of variables like phase shift, volume, damping, driver/hp construction and so on that all contribute to the final (and complex) picture. So I don't think it's easy to say square wave A beats B.

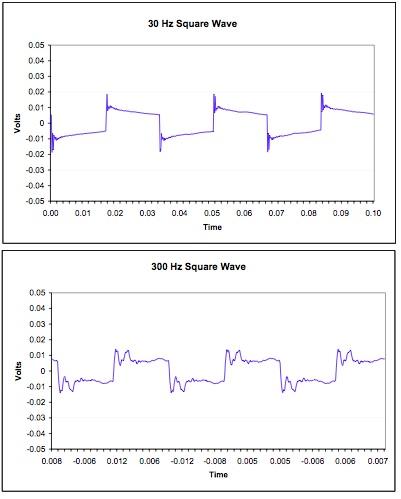
Could you take the same headphones and do the same measurement again but with a 30 Hz square wave? (picture would do)

Did you make those measurements at the same volume? Since the biggest component of a 50 Hz square wave is a 50 Hz sine wave, shouldn't the volume be matched at that frequency? (1 kHz seems to be the most commonly used base for volume matching)

Another thing: at headroom check out K701 and SRH840 frequency response and 50 Hz square waves and compare them. How would you explain the "the longer the line stays above the zero line, the better the base response" in that case? Afaik, the SRH840 is closed an has (p)leather pads - shouldn't that cause much more pressure than the open akg construction?
 

Users who are viewing this thread

Back
Top