So I looked at the wave forms at the input power connector to the FMC (Fibre Media Converter) with both the stock SMPS wall wart and a $46 LPS (Linear Power Supply) from China.
And while there are observable differences in ‘noise’ it is all ‘riding on top’ of the added’ noise’ that is being fed back into the power supply itself, by the active circuit under load (the FMC).
Describing it would be much more problematic than showing pictures, but even that would be problematic, so I figured I’d measure the ‘static’ noise into a 25KΩ resistor and use that as a baseline set of measurements and then show what the scope displays.
So I ignored the 9volts of dc and just looked at the amount and types of noise, of the ac signal riding on top of the 9vdc.
The Tek scope I’m using (468) has 3 ways of measuring the peak to peak voltages, which are Norm, Average and Envelope.
So here is a brief description of what they measure and why their numerical results are so different.
Norm is a short duration semi-frozen version of the waveform that shows the fast and more long term voltage spikes and hi-frequency noise.
Average is a sample of a medium time window view of the waveform that ignores ‘random’ voltages (the fast spikes), since it is looking for the average voltage (repetitive frequencies).
Envelope is a long term sample display of all of the voltages fast and slow, repetitive and random showing the sum total of all of it.
And these measurements were made at low frequency sweeps so I’d see all of the low and the higher freqs as well.
IOW the Norm is a fast snapshot of all of the voltages and frequencies including the spikes and fast transients but the displayed waveform is VERY dynamic and is constantly changing, faster than we can keep up with the flow of information.
The Average slows down the pace of change and focuses on where most of the noise resides but tends to ignore the fast spikes and transients.
The Envelope slows everything way down and shows all of everything in a cumulative display, but looses all the detail of the waveforms themselves, but it does show the maximal voltages.
So these are the numbers from the ‘static’ (P-P) measurements.
SMPS LPS ≈ % multiplier
Norm 20mv 7.3mv 36% x2.7
Average 3.54mv 1.26mv 36% x2.8
Envelope 197mv 40mv 20% x4.9
IOW you could say that the LPS is from 3 to 5 times less noisy, at least in this set of tests.
But that is only looking at peak to peak voltages and not the frequencies, nor the periodicity of this noise.
Put another way it is giving us the amounts of noise as a voltage but not the ‘quality’ of the noise.
That requires a personal evaluation and assessment, because there are no tests that directly relate a measurement of the noise to the SQ that results.
So I listen for audible changes that result from using the LPS vs. the SMPS.
And what I hear are SQ improvements very similar to those that the RN3 has made.
Specifically there is an increase in focus, especially where 2 (or more) ‘voices’ share very similar sonic attributes, such as background vocals, duets, and massed instruments, etc.
This increase in focus allows being able to differentiate between them and follow one or an other much more easily.
Now granted the improvement of using the LPS vs the SMPS isn’t anywhere near the same magnitude as when the RN3 was introduced into my system.
But that they exhibit nearly the same type of sonic improvement is telling in and of itself.
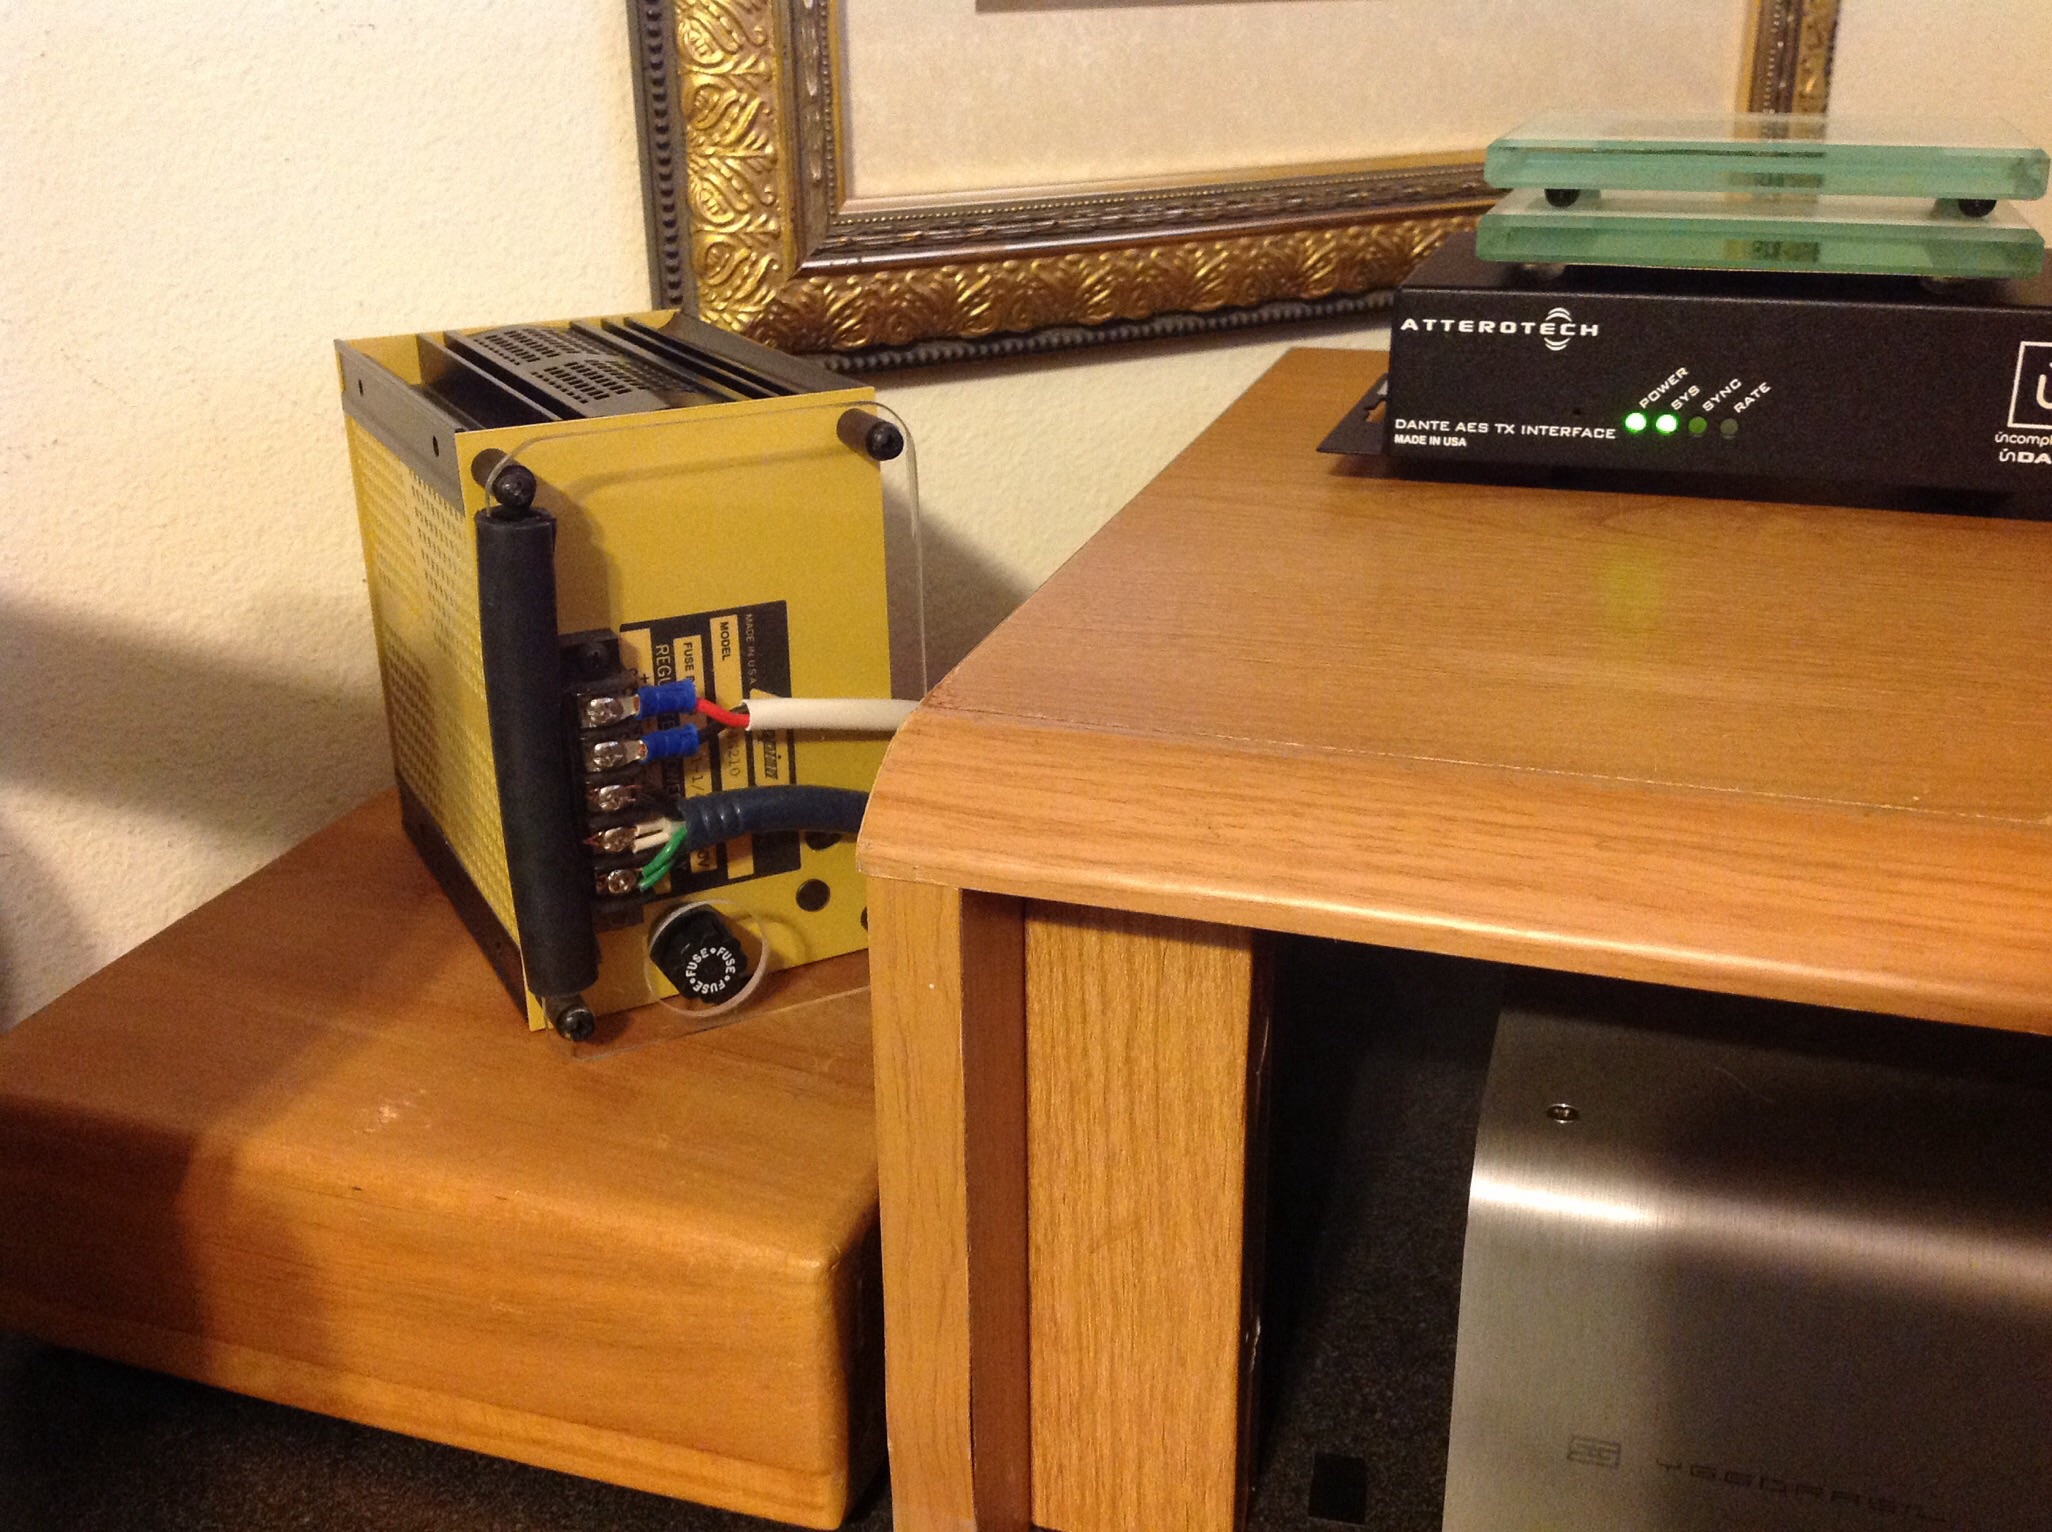
So this is the power supply I used, it’s a cheapy…
http://www.ebay.com/itm/External-Linear-Power-Supply-DC-for-CM6631-XMOS-DAC-USB-converter-led-display/131034415051?_trksid=p2047675.c100009.m1982&_trkparms=aid%3D888007%26algo%3DDISC.MBE%26ao%3D1%26asc%3D38828%26meid%3D1c6ed440b70b4896ba764695308d87d3%26pid%3D100009%26rk%3D1%26rkt%3D1%26sd%3D162096079417
And it has massive over capacity compared to the power draw of the FMC, so it’s loafing along, even though the LPS is only rated at 1.66 amps.
JJ


")

