


sachu
Headphoneus Supremus
- Joined
- Oct 29, 2006
- Posts
- 5,369
- Likes
- 155
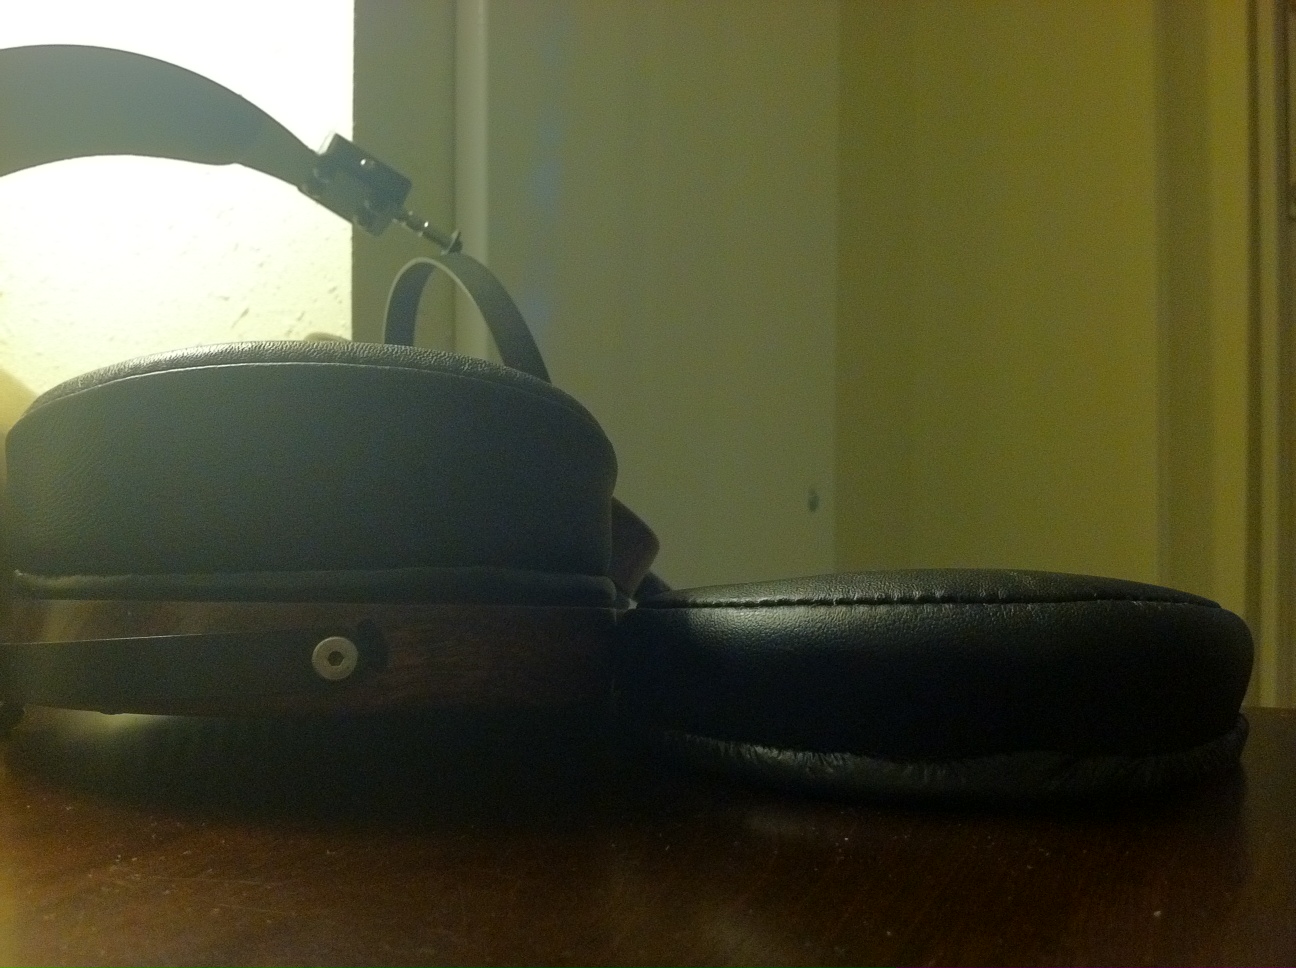
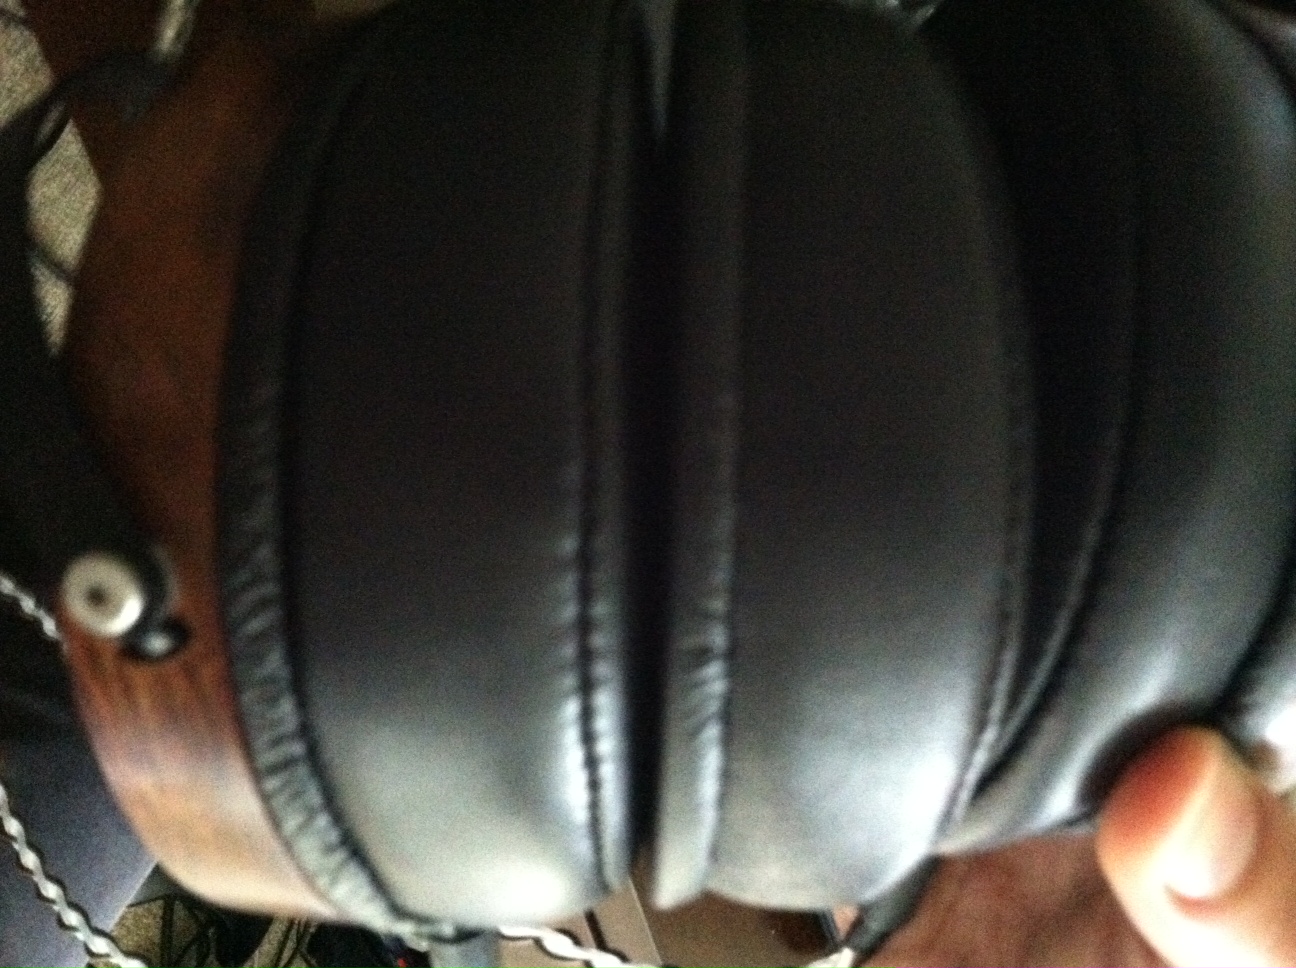
The headband has been redesigned..that is all the information i have..it is different from what they had at RMAF.
Pics will be forthcoming we are told..we await with bated breath.
Pics will be forthcoming we are told..we await with bated breath.


