Interconnect Impact on Electrical Waveform Lab with Results

Dec 9, 2008 at 8:59 PM Post #61 of 114
Very interesting results.

Thanks for doing that.

beerchug.gif
 
Dec 9, 2008 at 9:43 PM Post #62 of 114
Thanks for the clarifications , it makes more sense to me now. I applaud your efforts.

I really only have one remaining concern. Your sample window is set to 50ns (50 x 10 ^ -9 S) at this level you could not scope out audible frequencies, a single sample of a 44.1KHz sampled wave occupies 2.26 x 10 ^ -5 S , you are representing 1/20,000 of such a sample, anything less than MHZ frequencies would appear as a straight line at such zooming. If you take any audio sample and zoom it in too far it becomes a straight line. So what your pictures show is differences in noise distribution not how the different cables deal with audible frequencies.
 
Dec 9, 2008 at 9:52 PM Post #63 of 114
Quote:

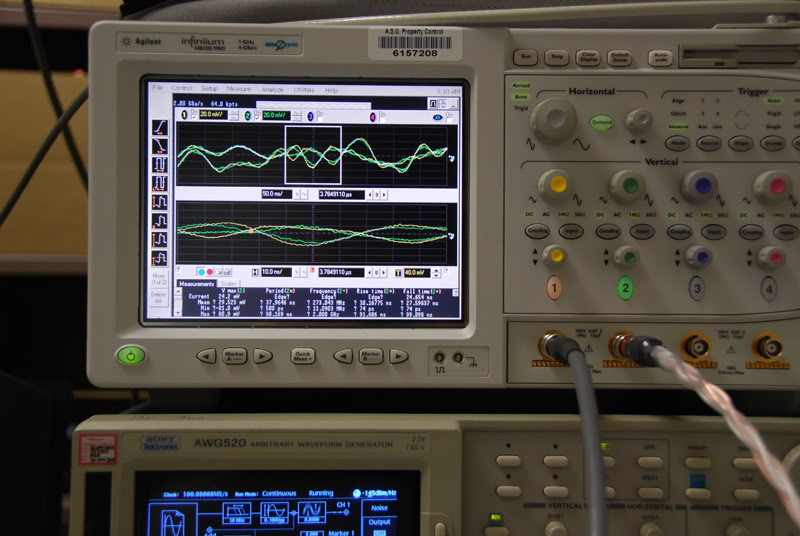
Originally Posted by digger945 /img/forum/go_quote.gif
WOW, Dave, I don't know what to say.
Impressive! Thank you! Tell us we will see more in the future.

On the bottom pic, what is the blue/gray waveform?


Actually I am working on several other projects right now. Some are head-fi related others not so much so expect to see more in due time. Darned school interfering with my education however.
biggrin.gif


Could you specify which picture?


Nick,
*EDIT* answered my own question!
How is it though that In this picture
DSC_0025.jpg

the sample size is set to 10 micro seconds yet 10khz triangles are visible?

What is noise distribution exactly?

Appreciate it!
Thanks for all the kind words and help

Dave
 
Dec 9, 2008 at 10:20 PM Post #64 of 114
Sorry Dave, it's the one below, the blue wave in the background.

DSC_0043.jpg

"which is the ALO A against the ALO A baseline. You cant see any distinct yellow or green which means the waves are equal."
 
Dec 9, 2008 at 11:15 PM Post #66 of 114
Sorry, let me explain better

In your post you spoke about the top of the scope showing a span of 50ns and the bottom of the scope a zoom representing 10ns. Assuming that what is visible in the picture is all that the scope shows, i.e that the view on the scope is not itself a virtual window then what the top part of the scope shows is a 50ns slice of time (0.000000050 seconds)

Let us say you generate a pure sine wave so that you can see one whole cycle of it (peak to peak) in the top part of the scope. This sine wave would have a frequency of 20MHZ ( 1 x 10^ 9 / 50) 20,000.000hz.

Quote:

Originally Posted by myinitialsaredac /img/forum/go_quote.gif
the sample size is set to 10 micro seconds yet 10khz triangles are visible?


What that is telling you is how frequently it samples the input not the width in time of the displayed wave. If the time slice shown is 10 x 10 ^ -6 (1 x 10 ^ -5) seconds then it is impossible to show even one wave as that would require a time slice of 0.1ms (1 x 10 ^ -4) .

If you fire up Audacity or Cool Edit pro and generate a 10K triangle/sawtooth wave and zoom out you will see when it stops being possible to see a single wave.

Quote:

What is noise distribution exactly?


Sorry what I meant was that you are seeing noise, but that the noise patterns of the different cables are different. Now obviously the less extraneous noise a cable transmits the better it is for audio, but if your 50ns window is correct you are slicing time so thinly that it is way beyond the human capacity to hear the differences even if they are massive at that scale. We can only sample sound at a relatively crude level in the order of a few ms.

Of course as soon as you zoom out to the point where it would be humanly detectable the differences lessen.
 
Dec 10, 2008 at 2:04 AM Post #67 of 114
Quote:

Originally Posted by nick_charles /img/forum/go_quote.gif
Sorry, let me explain better

In your post you spoke about the top of the scope showing a span of 50ns and the bottom of the scope a zoom representing 10ns. Assuming that what is visible in the picture is all that the scope shows, i.e that the view on the scope is not itself a virtual window then what the top part of the scope shows is a 50ns slice of time (0.000000050 seconds)

Let us say you generate a pure sine wave so that you can see one whole cycle of it (peak to peak) in the top part of the scope. This sine wave would have a frequency of 20MHZ ( 1 x 10^ 9 / 50) 20,000.000hz.


What that is telling you is how frequently it samples the input not the width in time of the displayed wave. If the time slice shown is 10 x 10 ^ -6 (1 x 10 ^ -5) seconds then it is impossible to show even one wave as that would require a time slice of 0.1ms (1 x 10 ^ -4) .

If you fire up Audacity or Cool Edit pro and generate a 10K triangle/sawtooth wave and zoom out you will see when it stops being possible to see a single wave.


Sorry what I meant was that you are seeing noise, but that the noise patterns of the different cables are different. Now obviously the less extraneous noise a cable transmits the better it is for audio, but if your 50ns window is correct you are slicing time so thinly that it is way beyond the human capacity to hear the differences even if they are massive at that scale. We can only sample sound at a relatively crude level in the order of a few ms.

Of course as soon as you zoom out to the point where it would be humanly detectable the differences lessen.


So do you believe that the results are pertinent, as in if the noise patterns of different cables are different than on the larger scale it still applies to the cabling being different?

I am under the impression that what I saw the 1/20000 will compound 20000 times to form the original wave right? So any differences I saw will also compound themselves in the original waveform. Now I'm not convinced that you can not see audible frequencies at smaller time samples, for example a 20khz wave is 20000 cycles per second right? But your ear does not require a full second of that wave to hear it, there should be both an upper and lower limit on hearing when the wave is too large or to small in reference to the time required to register sound. It is my understanding that a wave is composed of infinite points of sound to recreate the original wave where the determining factor is the limit on time required for the ear to hear. So would it be unreasonable to say that your are looking at about 2 and a half points in time (44100*1/20000) at 50ns?

Sorry for the babbling that was more of a train of thought than a paragraph. Its late so I will be back to the grind tomorrow!
Dave
 
Dec 10, 2008 at 6:37 PM Post #68 of 114
I would be curious to see the change in RFI with a known source of RFI noise in the room. That is, it would be interesting to see how effectively each cable can shield a signal from RFI in particular, versus just the background in the room. A good control would simply be a bare copper cable of equal length. I imagine any RFI injector would suffice...if nobody has ideas for a calibrated RFI source, you can always try an Ionic Breeze...
biggrin.gif
.
 
Dec 10, 2008 at 6:53 PM Post #69 of 114
Quote:

Originally Posted by myinitialsaredac /img/forum/go_quote.gif
So do you believe that the results are pertinent, as in if the noise patterns of different cables are different than on the larger scale it still applies to the cabling being different?


Your experiment does show electrical differences between cables, I do not doubt that at all and as I said you want as little noise as possible. Now what would also help is the vertical scale. For instance in some pictures there is a big visual difference between the two traces. Now if that diference is say the difference beween -80db and -100db that is pretty substantial and potentally audible, but if it is the difference between -80db and -79.9db that is almost certainly not audible.


Quote:

I am under the impression that what I saw the 1/20000 will compound 20000 times to form the original wave right? So any differences I saw will also compound themselves in the original waveform.


Yes , but the effect will be to make them appear less dramatic as you zoom out. The cables show +/- differences , zoomed out these will tend to average out somewhat as the time slice becomes bigger.

Quote:

Now I'm not convinced that you can not see audible frequencies at smaller time samples, for example a 20khz wave is 20000 cycles per second right?


Agreed, one 20KHz wave cycle peak to peak occupies 1/20,000 of a second or 50 microseconds, if you window is 50 microseconds you will see precisely one wave. If it is less you will see a portion of that wave.


Quote:

But your ear does not require a full second of that wave to hear it, there should be both an upper and lower limit on hearing when the wave is too large or to small in reference to the time required to register sound.


True, for humans the lower threshold for simple detection of audible stimulus is about 0.1ms (milliseconds) or 100 microseconds. However we also know we cannot hear much above 22Khz (very short wavelength) and below ~ 5hz (very long wavelength) sound is mostly felt not heard.


Quote:

It is my understanding that a wave is composed of infinite points of sound to recreate the original wave where the determining factor is the limit on time required for the ear to hear.


Sound waves are composed of compressions and rarefactions of air, it isnt really infinite as such as there are physical limits viz the size of air molecules which although very small are finite.

Quote:

So would it be unreasonable to say that your are looking at about 2 and a half points in time (44100*1/20000) at 50ns?


I did the maths wrong before, let me correct it. I will use a concrete example. Let us use a 1 hz sine wave sampled at 44,100hz as an example, we will set the scope to display a window of 1 second. So now we can see one complete wave cycle or 44,100 samples in the window.

Each of our 44,100 samples represents 1/44,100 of a second or
2.26 x 10 ^ -5 or 0.0000226 seconds.

Now if we set the window to 50ns (50 x 10 ^ -9 seconds) 0.00000005
Seconds. Our window is now ~ 1/453 of the width of one sample. I was wrong before ( I inversed the calculation) .

So you may actually see a sample or you may not, most likely not, but you are seeing something, that something will tend to be noise more often than signal.

Now white noise just like a complex music signal can be considered a combination of sine waves but a sampling system can still resolve this within its limits. So when you zoom in on your white noise signal you also get to the point where what you see is not white noise (signal) but just noise.

Now depending on the way that your white noise was generated you will see more or less signal dsplayed in your 50ns window. For instance if you set your sampling rate to 44.1K you have a 1/453 chance of seeing a sample in a 50ns window, if your sampling rate is 192K it is about 1/100.
 
Dec 10, 2008 at 7:02 PM Post #70 of 114
Quote:

Originally Posted by nick_charles /img/forum/go_quote.gif
Your experiment does show electrical differences between cables, I do not doubt that at all and as I said you want as little noise as possible. Now what would also help is the vertical scale. For instance in some pictures there is a big visual difference between the two traces. Now if that diference is say the difference beween -80db and -100db that is pretty substantial and potentally audible, but if it is the difference between -80db and -79.9db that is almost certainly not audible.


Sorry, you are making the logical error of simply multiplying one sample by a fixed factor assuming all that samples are the same, and since you are using white noise this will not be the case.


Agreed, one 20KHz wave cycle peak to peak occupies 1/20,000 of a second or 50 microseconds, if you window is 50 microseconds you will see precisely one wave. If it is less you will see a portion of that wave.


True, for humans the lower threshold for simple detection of audible stimulus is about 0.1ms (milliseconds) or 100 microseconds. However we also know we cannot hear much above 22Khz (very short wavelength) and below ~ 5hz (very long wavelength) sound is mostly felt not heard.


Sound waves are composed of compressions and rarefactions of air, it isnt really infinite as such as there are physical limits viz the size of air molecules which although very small are finite.


I did the maths wrong before, let me correct it. I will use a concrete example. Let us use a 1 hz sine wave sampled at 44,100hz as an example, we will set the scope to display a window of 1 second. So now we can see one complete wave cycle or 44,100 samples in the window.

Each of our 44,100 samples represents 1/44,100 of a second or
2.26 x 10 ^ -5 or 0.0000226 seconds.

Now if we set the window to 50ns (50 x 10 ^ -9 seconds) 0.00000005
Seconds. Our window is now ~ 1/453 of the width of one sample. I was wrong before ( I inversed the calculation) .

So you may actually see a sample or you may not, most likely not, but you are seeing something, that something is noise rather than noise.

Now white noise just like a complex music signal can be considered a combination of sine waves but a sampling system can still resolve this within its limits. So when you zoom in on your white noise signal you also get to the point where what you see is not white noise (signal) but just noise.

Now depending on the way that your white noise was generated you will see more or less signal dsplayed in your 50ns window. For instance if you set your sampling rate to 44.1K you have a 1/453 chance of seeing a sample in a 50ns window, if your sampling rate is 192K it is about 1/100.


Sorry for the babbling that was more of a train of thought than a paragraph. Its late so I will be back to the grind tomorrow!
Dave


Great post! Very detailed. Now what if you set your sampling rate to 100 million samples per second, or 1mhz?

Sorry I'm blasting you with questions, I'm writing na essay and working on a portfolio right now!

Dave
 
Dec 10, 2008 at 7:45 PM Post #71 of 114
Quote:

Originally Posted by myinitialsaredac /img/forum/go_quote.gif
Great post! Very detailed. Now what if you set your sampling rate to 100 million samples per second, or 1mhz?

Sorry I'm blasting you with questions, I'm writing na essay and working on a portfolio right now!

Dave


If your sample rate is set to 1mhz then each sample is 1/1,000,000 of a second or 1000ns, your window is 50ns now your probability of seeing a sample is 1/20 (0.05) , at 100mhz each sample is 10ns and you have a 50ns window so you get ~ 5.

However, your wave still tends to look like a straight line on the scope unless your signal is at an insanely high frequency.
 
Dec 10, 2008 at 7:53 PM Post #72 of 114
Quote:

Originally Posted by nick_charles /img/forum/go_quote.gif
If your sample rate is set to 1mhz then each sample is 1/1,000,000 of a second or 1000ns, your window is 50ns now your probability of seeing a sample is 1/20 (0.05) , at 100mhz each sample is 10ns and you have a 50ns window so you get ~ 5.

However, your wave still tends to look like a straight line on the scope unless your signal is at an insanely high frequency.


Thanks for the clarification! Might I ask you what you studied in school or what you are studying?
You seem well versed in this topic.

Dave
 
Dec 10, 2008 at 10:41 PM Post #73 of 114
This is what I like to see! Systematic controlled studies of the equiptment. Testing with human perception isn't always that reliable. I will acknowledge that the human perception system is very complicated so it is very difficult to determine how differences in one waveform from the next will be perieved by a person. The best example is that of comparing a lossy mp3 waveform to the original, you can see distinct differences on a scope yet a person connect perceive the difference (in most cases). However if you see no differences in two waveforms on a scope, you can be pretty much gaurenteed that a person will not percieve a difference (unless they have some pyschological bias). We need more tests like this. You can't argue with a test that says there is no difference in the output waveform on a scope.

As for the differences in the cables, I would guess that cable design and build are really the only factors that contribute to performance. If the cable is designed to isolate RFI and crosstalk and if it is made solid enough then it will perform well. I will acknowledge marginal benefits from gold plating contacts, but silver plating the entire cable provides dubious returns in perfomance IMHO.
 
Dec 10, 2008 at 10:51 PM Post #74 of 114
Quote:

Originally Posted by helicopter34234 /img/forum/go_quote.gif
This is what I like to see! Systematic controlled studies of the equiptment. Testing with human perception isn't always that reliable. I will acknowledge that the human perception system is very complicated so it is very difficult to determine how differences in one waveform from the next will be perieved by a person. The best example is that of comparing a lossy mp3 waveform to the original, you can see distinct differences on a scope yet a person connect perceive the difference (in most cases). However if you see no differences in two waveforms on a scope, you can be pretty much gaurenteed that a person will not percieve a difference (unless they have some pyschological bias). We need more tests like this. You can't argue a test that says there is no difference in the output waveform on a scope.

As for the differences in the cables, I would guess that cable design and build are really the only factors that contribute to performance. If the cable is designed to isolate RFI and crosstalk and if it is made solid enough then it will perform well. I will acknowledge marginal benefits from gold plating contacts, but silver plating the entire cable provides dubious returns in perfomance IMHO.


I am not sure as to what differences in the cabling provides the differences seen on the scope. I would assume it could be all of the factors of the cabling i.e. conductors dielectrics, rfi rejection, crosstalk, etc.etc., however this is not the place to discuss this. Keep in mind I am working on furthering my understanding of this subject and subsequent experiments are likely to follow.

Dave
 
Dec 10, 2008 at 11:21 PM Post #75 of 114
Quote:

Originally Posted by helicopter34234 /img/forum/go_quote.gif
You can't argue with a test that says there is no difference in the output waveform on a scope.


Sure you can, the oscilloscope is a tool like any other, with the given limitations and inaccuracies. I agree with the thrust of your praise; objective measurement with appropriate instruments and positive/negative controls is very appropriate! Good going OP! I'm just saying that 100% belief in instrumentation is not so different than the 100% belief in human senses that you were knocking
wink.gif
. Skepticism is the first thing! If you're a fan of Feynman, "The first principle is that you must not fool yourself--and you are the easiest person to fool. So you have to be very careful about that. After you've not fooled yourself, it's easy not to fool other(s)."
 

Users who are viewing this thread

Back
Top