Headphones are IIR filters? [GRAPHS!]
Aug 8, 2011 at 12:29 AM Thread Starter Post #1 of 26

Soaa-

100+ Head-Fier
Joined
Mar 23, 2010
Posts
418
Likes
44
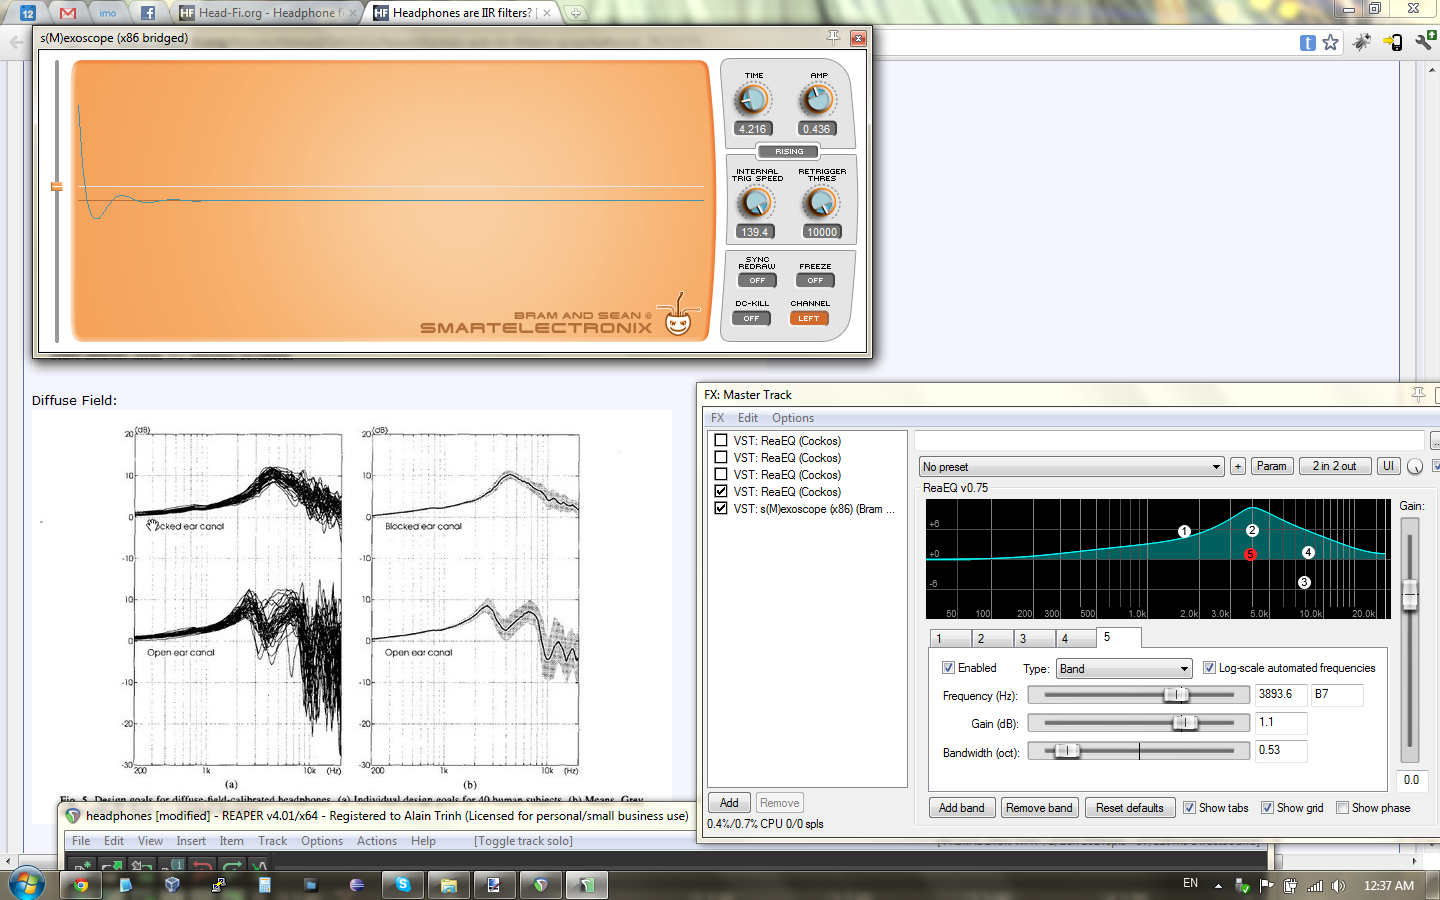
I had a hunch. Could a headphone's square wave and impulse response be a direct consequence of its frequency response? And so I tested, and here are my results. Here are my synthesized results. No headphones were used to create these images.
 
First off, tried to get the EQ to match the headphone's uncompensated response as closely as possible. Here it is along with the 30Hz square wave response for comparison.


Things get more interesting with the 300Hz square wave response.


And finally, impulse response.


My conclusion would be the following points:
 
  1. The exact square wave alone is irrelevant to sound quality.
  2. The overshoot in square wave response is normal, and is caused naturally by the concha of the ear. Any attempt to correct it would result in an unnatural response.
  3. The headphone's frequency response should closely match a target HRTF.
  4. The closer the headphones are to a perfect IIR filter representing the HRTF, the better.
  5. Any deviations from a perfect IIR filter are thus caused by imperfections in driver physics or other causes, and will impact the objective perfect response of the headphone. This doesn't necessarily imply that the headphone will sound bad, but it does mean that the waveform that it produces will be imperfect. This appears to be the case with multi-driver IEMs with crossover networks.
 
Your thoughts?
 
Aug 8, 2011 at 1:57 AM Post #2 of 26
It's quite unsurprising really, one can infer the parameters of the transfer function from the FR, and determine the impulse response, step response, response to a square wave etc...
So the all the other measurements are somewhat redundant when we already have the FR, however, it may provide a more visual tool for people to see how the headphones will sound.

I already posted on innerfidelity to comment on this, albeit with a slightly different formulation.
 
Aug 8, 2011 at 9:31 AM Post #3 of 26
Very cool man.   Very nicely done.
 
Yes, all the data is essentially the same information repackaged in different ways.  Usually each graph tends to hide some data.  FR hides phase relationships.  Impulse response hides the FR data. Square waves show some of each.  The important thing to note is that though they all contain the same information, displaying it in different ways makes certain aspects more intelligable for the viewer. It's cool stuff.
 
I Facebooked and Tweeted your post from @InnerFidelity.
 
 
Aug 8, 2011 at 10:27 AM Post #4 of 26
Tyll, how do you measure phase and what does the measurement represent? You overlay the plot on top of the electrical impedance, and it looks nothing like what I would expect from an audio output phase response graph...
 
Aug 10, 2011 at 12:18 AM Post #6 of 26
Moar! DT 48 E this time.


There's significantly less ring in the synthesized waveforms. I suspect it has to do with the artifact at 9kHz, which seems to be caused by something else than plain frequency response. Stored energy in the driver? Reverberations? Who knows?
 
Aug 10, 2011 at 1:52 AM Post #7 of 26
Do you think you can reconstruct a free and diffuse field frequency response and see what things look like?
 
Free Field:

 
Diffuse Field:

 
I'm guessing you'd want to use the open ear canal image 
confused.gif

 
Aug 12, 2011 at 12:45 AM Post #9 of 26
I suspect that the difference between open canal and blocked canal refers to headphones and IEMs. Headphones require a different voicing because the certain frequencies get amplified by the shape of the ear. This doesn't happen with IEMs, obviously.
 
30Hz square wave open canal DF:


300Hz square wave open canal DF:


Impulse response open canal DF:


30Hz square wave blocked canal DF:


300Hz square wave blocked canal DF:


Impulse response blocked canal DF:


Sorry if the scaling is different across screenshots!
 
Aug 13, 2011 at 11:33 AM Post #10 of 26


Quote:
Moar! DT 48 E this time.


There's significantly less ring in the synthesized waveforms. I suspect it has to do with the artifact at 9kHz, which seems to be caused by something else than plain frequency response. Stored energy in the driver? Reverberations? Who knows?


I was amazed you could actually reproduce so well the step response with just a few tuned filters. As Tyll said, these time / frequency domain graphs contain the exact same data and you can go from one to the other over and over again at no loss. I guess the impulse and step responses are particularly useful to look at a ringing and possibly some early reflections. But indeed, considering the target (like a diffuse field HRTF) is such a mess to start with, it doesn't sound too easy to interpret a headphone response in the time domain at least! For missing a log of the ringing with your filters, I assume it boils down to you visually picking the most visible resonance from the smoothed magnitudes response. There is probably much more rugged response of the headphone (with many more sharp peaks and valleys) if you look at the response in more "raw" form. Maybe Tyll could comment on this?
 
BTW, you probably now got a feel for this but the sharper the peak in the frequency response, the more it will ring in the impulse / step responses. Also, the lower the frequency, the more visible it will be on the impulse response (the higher frequency resonance have much shorter time decay).
 
Quote:
Do you think you can reconstruct a free and diffuse field frequency response and see what things look like?
 
Free Field:

 
Diffuse Field:

 
I'm guessing you'd want to use the open ear canal image 
confused.gif


This is neat data! I am a total noob on target equalization curves for headphones and the graphs above are really nice info. Is it from a reference book in that field? The interesting point is the huge deviation across the population which makes it hard to believe there is really a point to use a target being the population average. Maybe the one reasonable target is that of the dummy head calibration you're using for the headphone performance measurement (or then shooting for a flat target of a compensated headphone response curve)?
 
 
Aug 15, 2011 at 5:12 AM Post #11 of 26
Right, OK.  That throws everything I thought I knew about measurements out the window...
 
Heck I don't even know what an iir filter is.
 
Aug 22, 2011 at 12:28 AM Post #12 of 26
How did you generate these results? what programs did you use? I'm curious how you're doing this.
 
May 29, 2012 at 3:01 PM Post #13 of 26
Headphones are not IIR filters. Headphone are minimum phase systems. IIR filters are typically minimum phase. Therefore, if you apply IIR filters (like almost every parametric EQ uses) to a square wave and compare it to the measured square wave you get very similar results. To get almost identical results you'd need lots of filters and a high pass filter.

edit: FR (more correctly magnitude response) doesn't hide phase. It actually determines the phase response in a min. phase system. You can measure the FR (magnitude response) and convert it into a min. phase FIR filter, you can even invert the response and create a correction filter to theoretically make the resulting FR a flat line - or apply another headphones' filter to the correction filter to make one headphone sound like another. :wink:
 
May 29, 2012 at 6:16 PM Post #14 of 26
Interesting comment xnor, any reference on headphones being typically minimum phase? AFAIK, a speaker in a room has propagation phase in the nearfield and minimum phase characteristics when you get into reverberant field (see work from Lyon). I guess it's just a matter of checking a few headphones but I have not seen such comparisons yet. I also thought I had this conversation in another thread but did not go very far.
 
May 30, 2012 at 8:07 AM Post #15 of 26

Users who are viewing this thread

Back
Top