GS Audio Impressions Thread
Nov 9, 2021 at 7:55 PM Post #1,066 of 1,414
Waterfall plots for frequency response over time from full volume white noise to discontinuation of playback and the end of decay are my favorite way to visualize how something sounds. Usually, warm tuning means that you get extended decay. Brass is frequently used for this purpose because it is a naturally resonant metal, so you get the effect of extending decay slightly through chamber resonance. With waterfall plots, you get to see how the FR changes over the milliseconds after the signal is cut from the source and you get to watch how each individual driver behaves as it returns to its nominal state. You can see how well damped each driver is, how they interfere at crossover points, and how the IEM's internal structure design or material choices can create internal resonance, which leads to constructive or destructive interference and colors the sound.
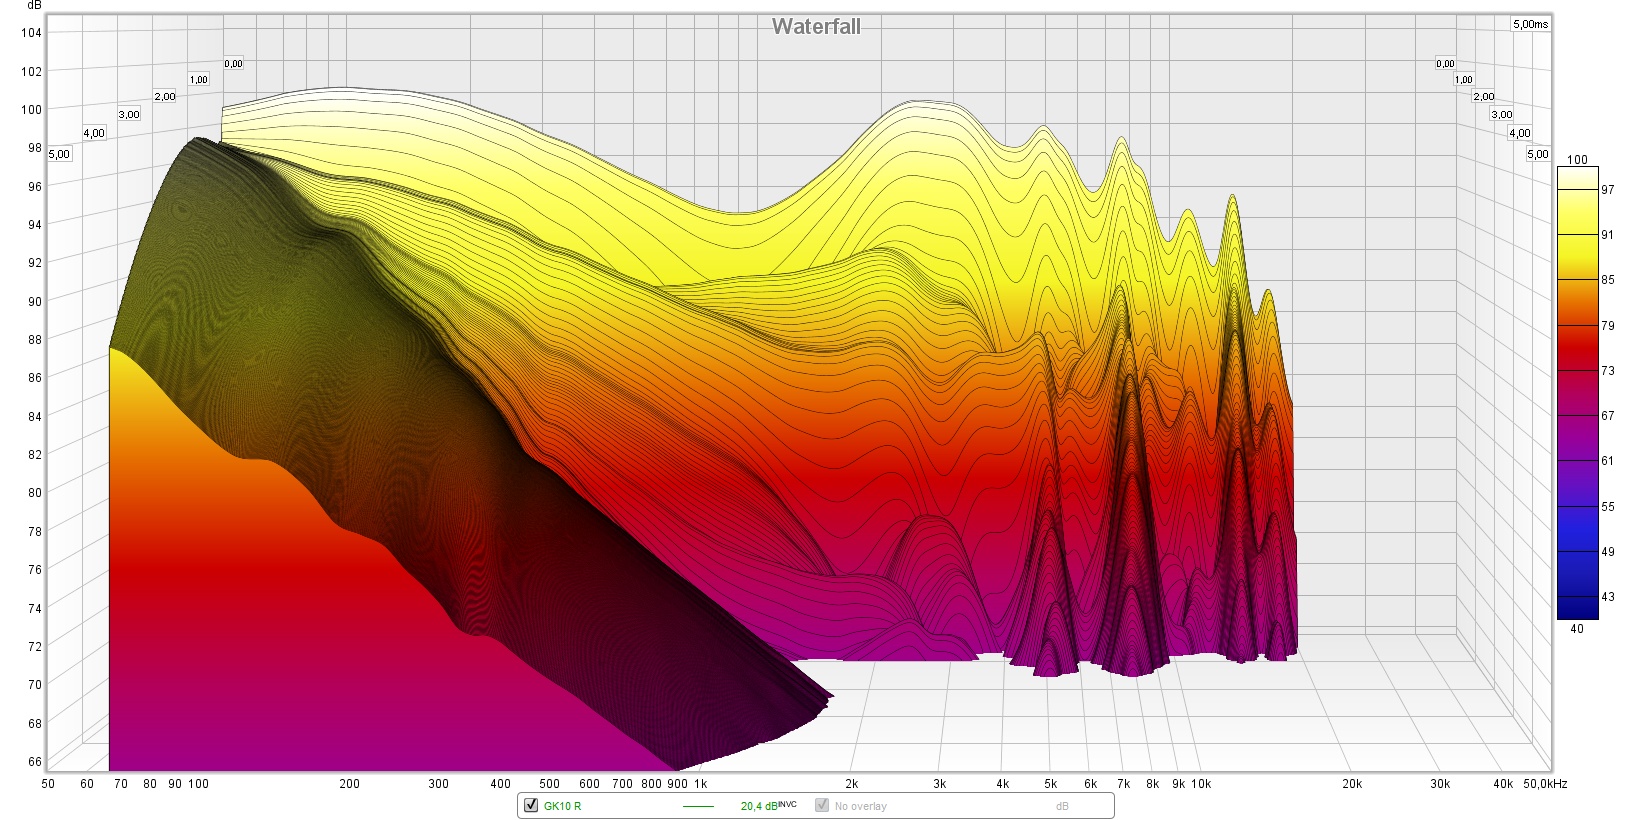
That probably explains why ba iems, and some DD iems sound less warm even when they look warm on graphs. The FDX1 is a great example of this, it probably has a very short decay compared to other DD iems because it sounds way less warm than my starfields even when I used the blue nozzle which should graph fairly close to warm, and try to eq the treble down, and lower frequencies up. The Kato is a better example, it's tuned almost the same as the starfields but still sounds way less warm, probably because it decays faster. Ba iems are already known to decay very fast so there isn't much surprise there. I wonder if it's possible to get the best of both worlds, a natural but fast decay that neither decays faster or slower than the sound is intended to, while still sounding warn.

On another note, I have no idea how to read waterfall graphs, or what to look for. The veedix silver string has a waterfall graph, heck it even shows partials in the fr curve graph but I still have no idea what to make of any of it.

This actually adds an interesting dimension to things, we've all been testing for burn in with just regular graphs, but what if it's only noticable in waterfall graphs? Same thing with cable differences, something like the skin effect would be a lot more noticable in waterfall graphs if it exists. No idea what the actual truth is so I don't have an opinion on those topics other than that I think it would be cool to have tested since I don't really trust human perception too much.

I think im going to pickup an iec711 coupler during 11/11 sales if nothing else. Would be fun to graph my iems and experiment a bit. Does anyone know if the coupler can make waterfall graphs? Sounds like it should be able to as long as the software can.
 
Last edited:
Nov 10, 2021 at 6:29 AM Post #1,067 of 1,414
I think im going to pickup an iec711 coupler during 11/11 sales if nothing else. Would be fun to graph my iems and experiment a bit. Does anyone know if the coupler can make waterfall graphs? Sounds like it should be able to as long as the software can.
It can, REW (the software used) measures everything.

1636543776247.png
 
Nov 10, 2021 at 7:02 AM Post #1,068 of 1,414
It can, REW (the software used) measures everything.

Interesting bit of resonance at 40Hz. It's definitely something to do with the design of the DD causing it, as it's highly modal. Since it's in a spot that people don't necessarily mind some extra decay, it's probably not an issue, but I'd like to see it improve on their new dynamic for the GD3C. I would expect that DD to have generally longer decay overall, based on what they should likely need to do to get the kind of bass performance they're targeting.

Edit: maybe that's the impedance peak, which is usually where the driver's free air resonance would be, and they've tuned the driver module, it's tiny little filtered rear port, and the enclosure to forcibly drive down the operating frequency range to 20Hz? I've never seen this done so successfully in standard loudspeaker designs, so if that's the case, then man are they good. Typically the free air resonance is where the driver has the strongest natural harmonics because of the electric spring force, mechanical spring force, mechanical damping force, and driver mass balancing out to create stable oscillations, basically, it's a spring force and weight reaching a kind of equilibrium wherein it takes little additional force to make it keep moving.
 
Last edited:
Nov 11, 2021 at 9:52 AM Post #1,069 of 1,414
It can, REW (the software used) measures everything.

1636543776247.png
So if waterfall plots give so much info on how an iem sounds and is much more useful, why does knowbody do it?
The whole point of graphing an earphone/headphone is to give users a better understanding of how it sounds and useful info to gauge whether or not to risk purchasing it. Line graphs can be very deceptive.
I've always wished the community would switch from simple line graphs to waterfall plots.
 
Nov 11, 2021 at 9:57 AM Post #1,070 of 1,414
So if waterfall plots give so much info on how an iem sounds and is much more useful, why does knowbody do it?
Squig doesnt have it, probably very hard to look at multiple watergraphs at once like we do with the regular graphs and personally, I have no clue how to read them.
 
Nov 11, 2021 at 8:04 PM Post #1,071 of 1,414
Squig doesnt have it, probably very hard to look at multiple watergraphs at once like we do with the regular graphs and personally, I have no clue how to read them.
It doesn't help when you've only got fairly normal looking graphs to try to interpret. Check out the graphs of the Geek Would GK10 in this post:
https://www.head-fi.org/threads/geek-wold-discussion-gk10.958787/post-16591573
11594070.jpg

This is from the side without the bent mesh grille. Graph weirdness becomes so much more obvious when you've got such a prime example like the GK10. You've got massively slow decay on the bass DD, and you can see based on how the decay plot wobbles up and down between about 1kHz and 2kHz that we've got some driver interference going on and it's causing constructive, then destructive interference. Due to how little wobble we see at the decay peaks at 5kHz, 8kHz, and 15kHz, these are most likely resonance peaks from the drivers themselves and not due to multiple driver interference.
 
Nov 11, 2021 at 8:12 PM Post #1,072 of 1,414
It doesn't help when you've only got fairly normal looking graphs to try to interpret. Check out the graphs of the Geek Would GK10 in this post:
https://www.head-fi.org/threads/geek-wold-discussion-gk10.958787/post-16591573
11594070.jpg

This is from the side without the bent mesh grille. Graph weirdness becomes so much more obvious when you've got such a prime example like the GK10. You've got massively slow decay on the bass DD, and you can see based on how the decay plot wobbles up and down between about 1kHz and 2kHz that we've got some driver interference going on and it's causing constructive, then destructive interference. Due to how little wobble we see at the decay peaks at 5kHz, 8kHz, and 15kHz, these are most likely resonance peaks from the drivers themselves and not due to multiple driver interference.
That looks like a local mountain where I almost died doing out of bounds skiing
 
Last edited:
Nov 11, 2021 at 8:29 PM Post #1,073 of 1,414
That looks like a local mountain where I almost died going out of bounds skiing
It really does. It's absolutely crazy to compare it to single-DD set graphs where they've got impeccably well tuned chambers and it's just pure decay coherency. The peaks in the decay are highly modal and seem purely down to the driver resonance and chamber resonance.

There's a post about the NF Audio sets here:
https://www.head-fi.org/threads/the-discovery-thread.586909/post-16643838

With these graphs:
NM2+
NM2_Waterfall.jpg

NA2+
NA2_Waterfall.jpg
 
Nov 12, 2021 at 12:15 PM Post #1,074 of 1,414
It really does. It's absolutely crazy to compare it to single-DD set graphs where they've got impeccably well tuned chambers and it's just pure decay coherency. The peaks in the decay are highly modal and seem purely down to the driver resonance and chamber resonance.

There's a post about the NF Audio sets here:
https://www.head-fi.org/threads/the-discovery-thread.586909/post-16643838

With these graphs:
NM2+
NM2_Waterfall.jpg
NA2+
NA2_Waterfall.jpg
These types of graphs seen way more useful to me. Going to be a bit of a learning curve trying to learn how to read them. Well that explains one mystery to me. Over in one of the more popular rank your iems thread here I see a lot of people with huge and expensive collections rating the na2+ or nm2+ either at the top or at least top three. Even a few of the guys I have purchased iems off of who have huge collections and expensive collections told me their favorite iem is the na2+. Definitely not my type of tuning since I like things in the relaxed side so I'm not running out to go and buy them but it goes to show sometimes it's not about how expensive your iem is.

On another note, I wish more manufactures would provide waterfall graphs and that there were guides for reading this stuff. The only one I've seen provide one is for the veedix silver string.. and I still don't have the faintest clue how to read it yet, or what to make of it. Graph is in the product description here: https://m.aliexpress.com/item/1005001839459559.html if you can get it to load for you (won't for me for some reason otherwise I'd just share the picture here)

Considering how nobody makes or publishes these graphs I'm even more excited to get my hands on an iec711 coupler to play around with.
 
Nov 12, 2021 at 6:23 PM Post #1,075 of 1,414
These types of graphs seen way more useful to me. Going to be a bit of a learning curve trying to learn how to read them. Well that explains one mystery to me. Over in one of the more popular rank your iems thread here I see a lot of people with huge and expensive collections rating the na2+ or nm2+ either at the top or at least top three. Even a few of the guys I have purchased iems off of who have huge collections and expensive collections told me their favorite iem is the na2+. Definitely not my type of tuning since I like things in the relaxed side so I'm not running out to go and buy them but it goes to show sometimes it's not about how expensive your iem is.

On another note, I wish more manufactures would provide waterfall graphs and that there were guides for reading this stuff. The only one I've seen provide one is for the veedix silver string.. and I still don't have the faintest clue how to read it yet, or what to make of it. Graph is in the product description here: https://m.aliexpress.com/item/1005001839459559.html if you can get it to load for you (won't for me for some reason otherwise I'd just share the picture here)

Considering how nobody makes or publishes these graphs I'm even more excited to get my hands on an iec711 coupler to play around with.
If the graph from their AE listing is accurate, then they really are good at tuning. In the 3D waterfall, they have close to single DD coherency, though they appear to provide a flattened waterfall that shows just a very minimal amount of harmonic interference at the crossover points between the DD and BA. I don't see it on the 3D waterfall graph, so maybe it's just quite insignificant.
 
Nov 12, 2021 at 9:10 PM Post #1,076 of 1,414
It doesn't help when you've only got fairly normal looking graphs to try to interpret. Check out the graphs of the Geek Would GK10 in this post:
https://www.head-fi.org/threads/geek-wold-discussion-gk10.958787/post-16591573
11594070.jpg

This is from the side without the bent mesh grille. Graph weirdness becomes so much more obvious when you've got such a prime example like the GK10. You've got massively slow decay on the bass DD, and you can see based on how the decay plot wobbles up and down between about 1kHz and 2kHz that we've got some driver interference going on and it's causing constructive, then destructive interference. Due to how little wobble we see at the decay peaks at 5kHz, 8kHz, and 15kHz, these are most likely resonance peaks from the drivers themselves and not due to multiple driver interference.
This totally proves what im trying to say. When you just look at the GK10 line graph its not great but also not too bad. Even justifiable depending on your music and tastes. But as soon as you see the waterfall plot its obvious a lot of unwanted things are going on to the point that most if not everyone should take a hard pass.
Again, this is only clearly fleshed out through the waterfall plot. And thats my whole point. Why not have this type of deeper insight for all earphones/ heaphones? I wish more people posted the waterfall plots thats all.
 
Nov 12, 2021 at 9:56 PM Post #1,077 of 1,414
This totally proves what im trying to say. When you just look at the GK10 line graph its not great but also not too bad. Even justifiable depending on your music and tastes. But as soon as you see the waterfall plot its obvious a lot of unwanted things are going on to the point that most if not everyone should take a hard pass.
Again, this is only clearly fleshed out through the waterfall plot. And thats my whole point. Why not have this type of deeper insight for all earphones/ heaphones? I wish more people posted the waterfall plots thats all.
I try not to judge people for what they like, particularly in such a subjective hobby, but it does baffle me how people hold the GK10 up as a giant killer when it has so much weirdness going on in its coherency because they're using, like, five drivers and only two of them are ostensibly the same, and those are the piezo tweeters. When you try to combine so many different drivers with so many different characteristics, unless you're willing to throw a huge amount of money into designing the sound enclosure to tune resonance and harmonics, you're going to have a preposterously difficult time achieving an acceptable level of coherency. The weirdness about the 4-10kHz range with the destructive and constructive interference may also explain why I thought the treble sounded "crunchy". There's also something I'm struggling to figure out with the bass decay at the 1ms range. It appears to just plummet due to some kind of interference. I have to wonder if they didn't actually cross over the graphene driver, but instead just ran it in parallel with the titanium driver and the more rapid decay of the graphene driver caused it to go out of phase with the titanium driver and just annihilated the bass gain at 1ms until it went back into phase again and finished decaying at around 2ms.
 
Nov 12, 2021 at 10:00 PM Post #1,078 of 1,414
I try not to judge people for what they like, particularly in such a subjective hobby, but it does baffle me how people hold the GK10 up as a giant killer when it has so much weirdness going on in its coherency because they're using, like, five drivers and only two of them are ostensibly the same, and those are the piezo tweeters.
Perhaps you should buy one and hear it your own and you might get the answer only if you have not bought it.
 
Nov 12, 2021 at 10:07 PM Post #1,079 of 1,414
Perhaps you should buy one and hear it your own and you might get the answer only if you have not bought it.
Oh, I have. I ended up needing to use Amazon's A-to-Z Satisfaction Guarantee to get a refund because they were legitimately unusable to me. The treble sounds crunchy to me and the bass is very heavily undercut and fails to support the more substantial midbass, leading to a fairly hollow sounding, overblown bass. The mids were also just not cutting it for me either, but I don't think it was necessarily because of the driver choice for the mids, but because it just wasn't tuned properly to stand up to the rest of the drivers doing their thing. It's definitely a weird set and I don't personally understand the appeal at all. I'm sure there's genres it's suitable for even with the features I perceive as defects, but I just feel the amount of hype it received was wholly unjustified.
 
Nov 13, 2021 at 12:56 AM Post #1,080 of 1,414
If the graph from their AE listing is accurate, then they really are good at tuning. In the 3D waterfall, they have close to single DD coherency, though they appear to provide a flattened waterfall that shows just a very minimal amount of harmonic interference at the crossover points between the DD and BA. I don't see it on the 3D waterfall graph, so maybe it's just quite insignificant.
Someone should really take the plunge on these then cause they graph like the teas too it looks like. These are probably really good. I wish someone would compare these to the teas.

This totally proves what im trying to say. When you just look at the GK10 line graph its not great but also not too bad. Even justifiable depending on your music and tastes. But as soon as you see the waterfall plot its obvious a lot of unwanted things are going on to the point that most if not everyone should take a hard pass.
Again, this is only clearly fleshed out through the waterfall plot. And thats my whole point. Why not have this type of deeper insight for all earphones/ heaphones? I wish more people posted the waterfall plots thats all.
Yeah this further makes me want to get an iec711, definitely my next purchase before I get anymore iems. I mostly want it to figure out what it is I don't like so much in other iems and what I do like but it's gonna be interesting seeing what else these other types of measurements can reveal.

I would love to see how well the gt12x and st8b graph on a waterfall, going to see if I can order both in the near future
 

Users who are viewing this thread

Back
Top