Can you hear the difference?
Jan 3, 2013 at 4:35 PM Post #31 of 113
Quote:
 
My guesstimate is that a is originally 24 bit at at least 88,2 kHz sampling rate, b some MP3 and c 44,1-48 kHz / 16-24 bit.


All 3 files have substantial content above 22khz - all 3 show the exact same and consistent pattern of gradual energy decline as frequency goes up, all three bottom off at about -107db at about 48khz consistent with 96Khz sampling but none show the falling off a cliff characteristic of MP3 or the brick wall decline to nothing at 22050 or thereabouts of 44.1 sampling... 
 
Jan 3, 2013 at 4:41 PM Post #32 of 113
The sample was taken from Chuck Mangione - The Feeling's Back, unaltered 24/96 LPCM.

C is the original, unaltered sample.

B is what I call fake 96 kHz. Let me explain.
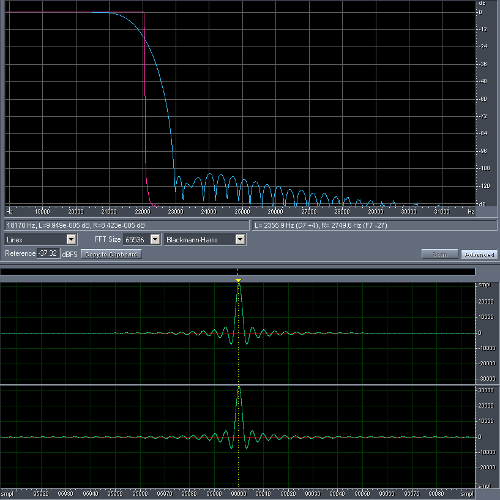
The file was filtered exactly like resampling to 44.1 kHz would, removing everything above 22.05 kHz.
To make the file indistinguishable from C, I had to add some high-frequency content. I chose completely random (white) noise, shaped to match the waveform.

A is CD quality, the "worst" in the set, because additionally to the processing done to B the bit depth was changed to 16 bits. 1 bit TPDF dither was used, no noise shaping (so no one can complain about moving the noise beyond 22.05 kHz).

--> C > B > A


--> If you prefer A, you prefer 44.1/16 (resampled to 96 kHz with added HF noise and bursts thereof) to 44.1/24 and even 96/24.
 
 
Jan 3, 2013 at 4:44 PM Post #33 of 113
I alone clearly heard the differences 
very_evil_smiley.gif
.
Ok! I am lying.  I "think" I noticed  the trumpet on B doesn't sound right to my ears???? 
confused.gif

So would go A -} C -} B (can't find the toppled triangle on my keyboard 
blink.gif
)
 
Jan 3, 2013 at 4:48 PM Post #34 of 113
Quote:
So would go A -} C -} B (can't find the toppled triangle on my keyboard 
blink.gif
)

Nope. Posted the solution above in the spoiler. (It's not a toppled triangle, it's the greater than sign.)
 
Jan 3, 2013 at 4:49 PM Post #36 of 113
Aw shucks, I forgot to post my impressions before the reveal.
 
I couldn't really hear anything different.  Pairwise ABX results:
 
A vs. B 9/15 — I think A is better, as a complete guess?  (Obviously it is, it's first!)
B vs. C 11/15 — I don't even want to guess, maybe C?
A vs. C 8/15 — ugh I give up.  A?
 
 
Was on a pro guessing streak for a while.
 
Jan 3, 2013 at 4:50 PM Post #38 of 113
Heh, as long as you're wrong posting after the reveal is ok.
wink.gif

 
edit: Btw, files were downloaded ~33 times. Almost 50% participated and posted here, thanks everyone.
 
Jan 3, 2013 at 4:52 PM Post #39 of 113
Wow.
 
Nicely done xnor.
 
Do a few more of these and think about writing a paper :)
 
Jan 3, 2013 at 5:12 PM Post #41 of 113
Quote:
Heh, as long as you're wrong posting after the reveal is ok.
wink.gif

 
edit: Btw, files were downloaded ~33 times. Almost 50% participated and posted here, thanks everyone.


Very interesting and very impressive. How long did it take you to get the waveforms to look the same. I ran them through Audacity and charted them and they all have the same pattern apart from at about 45K where there is a 3 - 3.5db difference but this is so far down it would make no difference but the changeover round 22.05K looks seamless and is within a couple of thousands of a db - nice work !
 
Jan 3, 2013 at 5:18 PM Post #43 of 113
Well it did take some time experimenting to get the white noise to look the same on a spectrum analyzer as the content in the real 96 kHz file, but once I figured that out I just wrote a script that does all the processing.
 
Jan 3, 2013 at 5:25 PM Post #44 of 113
Quote:
The sample was taken from Chuck Mangione - The Feeling's Back, unaltered 24/96 LPCM.

A is CD quality, the "worst" in the set, because additionally to the processing done to B the bit depth was changed to 16 bits. 1 bit TPDF dither was used, no noise shaping (so no one can complain about moving the noise beyond 22.05 kHz).

 
It is in fact still "shaped" compared to real CD quality audio, because the unweighted RMS level of the dither noise is still -93.3 dBFS, but that is for 0-48 kHz, so now slightly more than half the noise power falls above 22.05 kHz, and the noise in the audio band is reduced by slightly more than 3 dB.
 
Jan 3, 2013 at 5:36 PM Post #45 of 113
Quote:
Well it did take some time experimenting to get the white noise to look the same on a spectrum analyzer as the content in the real 96 kHz file, but once I figured that out I just wrote a script that does all the processing.

 
It actually works almost too well, because much of the content above 22.05 kHz is recovered, and there are only minor differences. I even guessed wrong that B is the original file. The graph below is at sample 1430876 of B (red) and C (green):


For those who want to try a comparison against "real" CD quality audio, here is a d.flac file that I created by converting c.flac to 44.1/16 format, and then converting the result back to 96/24 (with a relatively short FIR lowpass filter to roughly simulate a DAC).
 

Users who are viewing this thread

Back
Top