An interesting thing to know about impulse responses is that in practice they are often not measured by using a simple impulse as the input, but rather a
maximum length sequence, which is a pseudo-random pattern that contains all frequencies at the same level, but different phase, such that the same amount of energy is distributed over a much longer time, allowing for greater signal energy at the same peak level, and thus attenuating the noise in the system. By convolving the maximum length sequence with its reverse, the impulse response can be extracted.
To show this in practice, here is a maximum length sequence (polynomial = x^20 + x^3 + 1, so it repeats after 1048575 samples) played at 96 kHz, and recorded from a headphone:

Of course, that does not look like an impulse response at all, but convolving it with the reverse sequence (polynomial = x^20 + x^17 + 1) does extract the actual impulse response, and that can be seen below with the frequency response:

The reason why maximum length sequences are useful for impulse response measurements is that they allow for reducing the noise floor. Compare the noise floor of the audio recorded from the microphone (on the left) to that of the extracted impulse response (on the right). Since the signal was amplified as well during the convolution, the difference is in fact even greater than it is visually apparent from the pictures.


From the impulse response, it is possible to derive the step response (top), 30 Hz square wave response (bottom left), and 300 Hz square wave response (bottom right) with convolution. Note that I did not actually record any of these signals, only the MLS shown on the first picture, everything else is calculated from that.


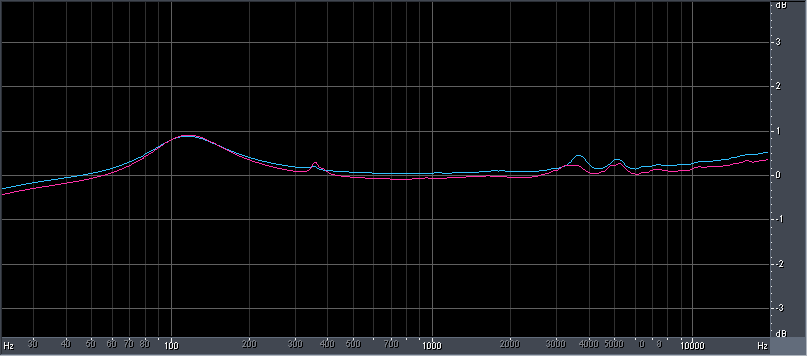
Of course, to get reasonably accurate results, the system (the entire chain of the DAC, headphone amplifier, headphones, microphone, microphone amplifier, and ADC) has to be close enough to linear time invariant. To verify that, I also show the frequency response and distortion vs. frequency calculated from a sine sweep played at a roughly similar RMS level. Fortunately, these are not Apple ear buds, so the distortion (much of which on the graph is actually microphone noise) is low enough, and the frequency response does not notably differ from that recorded with a completely different test signal and at a different time either.


")

