using waterfall graphs with headphones
Dec 2, 2009 at 7:18 AM Thread Starter Post #1 of 16

Justice Strike

100+ Head-Fier
Joined
Jan 25, 2008
Posts
379
Likes
12
I've seen a lot of graphs containing info on response, ohms etc.. etc.. etc..

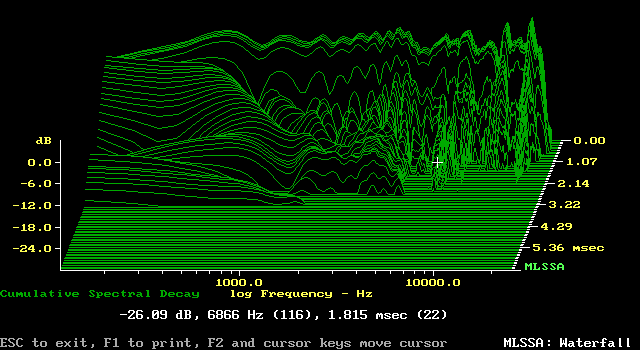
but i have not seen any waterfall graphs which show that a speaker is fast or not. All is based on hearing. Why is it that nobody doing a review bothers with these graphs?

here is an example:
QUAD2-WTR.gif


in a nutshell the graph shows how fast sounds die off for specific frequencies. Obviously, the faster the better.
 
Dec 2, 2009 at 8:04 AM Post #2 of 16
These measurements are a precious rarity. Ryumatsuba has some on his site now.
 
Dec 2, 2009 at 8:23 AM Post #3 of 16
these graphs are perhaps the best graphs to be used for sound signature. It not only gives you a sense of how the speaker sounds, but also how it dies of (and thus show a total signature of the headphone)
 
Dec 2, 2009 at 9:02 AM Post #4 of 16
I guess one issue is that to extract all the data present there you really need some kind of 3D visualizing software. It really loses a lot printed as shown above unless you want to print like 30 variations at different opacities, angles, and zoom levels.

EDIT A question I have is why do we use log(freq)? Is 10 -1000Hz really so much more important than the rest of the spectrum (10-20kHz is basically meaningless as shown in log scale)? I've always wondered why headroom doesn't have a dB-freq graph option.
 
Dec 2, 2009 at 10:57 AM Post #6 of 16
Quote:

Originally Posted by rds /img/forum/go_quote.gif
EDIT A question I have is why do we use log(freq)? Is 10 -1000Hz really so much more important than the rest of the spectrum (10-20kHz is basically meaningless as shown in log scale)? I've always wondered why headroom doesn't have a dB-freq graph option.


Headphone measurements above 10khz become increasingly unreliable due to testing conditions.
 
Dec 2, 2009 at 11:15 AM Post #8 of 16
these graphs are not unknown in the headphone world. there are a number of really interesting ones, notably that for the Q010 - extremely fast decay time
 
Dec 2, 2009 at 12:20 PM Post #10 of 16
Quote:

Originally Posted by MrGreen /img/forum/go_quote.gif
can someone explain how to interpret these?


yes.

so you have the amplitude on the x axis the frequency on the y axis and the z axis is for time. To test decay of sound white noise is blasted over the headphone. Which can be recorded in frequency and amplitude. At a certain point in time the white noise is cut off. This graph records the amplitude and frequency from the moment the whitenoise is cut off. Anything recorded is seen in the graph and shows the residuals of the sound that was blasted before. Ideally you want the phones to not show anything when the sound is cut off. But there will always be some residuals.
 
Dec 3, 2009 at 1:45 AM Post #11 of 16
Actually, a headphone without decay would have quite a compressed soundstage unless the recording was mastered for (decayless) headphones.
 
Dec 3, 2009 at 4:14 AM Post #12 of 16
Quote:

Originally Posted by Justice Strike /img/forum/go_quote.gif
hmm? it shows the info perfectly. You see that the bass in this graph has a decay of a good 3.22 milliseconds as opposed to the highs which decay within 2.14 for the most part.


A 2D view of a 3D object will not show the info perfectly, because there is one dimension missing
wink.gif
Try to trace out a decay line along 100Hz and you will see what I mean. Similarly when you look at info around 10kHz it's very hard to get much of an idea how that is decaying from the image shown. You can see how long it takes to decay, but not the pattern of decay.

Quote:

Originally Posted by anetode /img/forum/go_quote.gif
Headphone measurements above 10khz become increasingly unreliable due to testing conditions.


That seems odd since 20kHz is a very low frequency to measure. I wouldn't expect any problem sampling that frequency. Maybe a better mic is in order?
 
Dec 3, 2009 at 8:30 AM Post #13 of 16
I would imagine that, because of the way headphones treat HRTFs (or ignore them, rather) measurements like these would be somewhat unreliable, or at the very least more reliable as a comparative measurement against other headphones than as an absolute representation of sound signature. Besides, getting proper measurements with headphones in of itself is a very tricky process which really isn't done properly very often.

But, I do agree that this is something that needs to be worked out, and proper measurements need to be out there. I think that there will be some very serious eye-openers if more-or-less reliable data on some of the newer stuff out there makes it into the open.
 
Dec 3, 2009 at 9:00 AM Post #14 of 16
Quote:

Originally Posted by catscratch /img/forum/go_quote.gif
I would imagine that, because of the way headphones treat HRTFs (or ignore them, rather) measurements like these would be somewhat unreliable, or at the very least more reliable as a comparative measurement against other headphones than as an absolute representation of sound signature. Besides, getting proper measurements with headphones in of itself is a very tricky process which really isn't done properly very often.

But, I do agree that this is something that needs to be worked out, and proper measurements need to be out there. I think that there will be some very serious eye-openers if more-or-less reliable data on some of the newer stuff out there makes it into the open.


HeadRoom has changed their measurement graphs for the HD 228 at least twice, with wide variations in the bass portion of the frequency response, and significant changes in square wave response. I guess they're having a hard time situating the headphones properly on the dummy head. Kinda makes you wonder how often they get their headphone measurements completely wrong for one reason or another, and never realize it.
 
Dec 3, 2009 at 9:57 AM Post #15 of 16
Quote:

Originally Posted by Justice Strike /img/forum/go_quote.gif
yes.

so you have the amplitude on the x axis the frequency on the y axis and the z axis is for time. To test decay of sound white noise is blasted over the headphone. Which can be recorded in frequency and amplitude. At a certain point in time the white noise is cut off. This graph records the amplitude and frequency from the moment the whitenoise is cut off. Anything recorded is seen in the graph and shows the residuals of the sound that was blasted before. Ideally you want the phones to not show anything when the sound is cut off. But there will always be some residuals.


haha oh its 3 dimensional.
I think I get it.
so 0ms is just before/as the sound ends, and then it continues to draw the results until the sound dissipates (flat lines), right?

Sweet.
 

Users who are viewing this thread

Back
Top