atomicbob
500+ Head-Fier
- Joined
- May 27, 2012
- Posts
- 986
- Likes
- 1,036
Typical audio device specifications include distortion specifications which are published as follows:
THD less than 0.02%
THD less than 0.02% at 1 KHz
THD less than 0.02%, 20 Hz to 20 KHz, 0 dBu, 300R load
The first specification is meaningless. It provides no information about the measurement conditions. The second is a little better acknowledging THD was measured at a single frequency with no level or load specified. It is not very useful unless you listen primarily to 1 KHz sinusoids. The third specification provides the frequency range over which the measurements were acquired, the voltage level and load used. This is a much more complete and honest specification. Yet greater insight may be derived from viewing the graph which produced that last specification.
Acronyms
THD = Total Harmonic Distortion
THD+N = Total Harmonic Distortion + Noise
dBu = dB referenced to 0.775 Vrms
Consider the following example:

Points of interest
1. Fundamental 300 Hz sinusoid at -26.55 dBu
2. 2nd harmonic 600 Hz sinusoid at -96.22 dBu
3. Calculated THD for 300 Hz both numeric display and point on graph
4. Calculated THD+N for 300 Hz, numeric display and point on graph
5. 60 Hz mains noise at -90 dBu
6. 180 Hz mains noise at -105 dBu
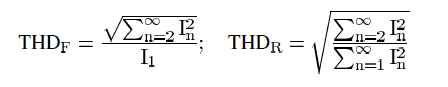
THD adds the dB levels of 2nd and higher harmonics of the fundamental input sinusoid found in the FFT, and compares the result to the fundamental in the FFT.
THD+N adds dB levels of everything in the FFT except the fundamental, and compares to the fundamental, which typically results in a larger number due to inclusion of noise.
Here are some useful equations.

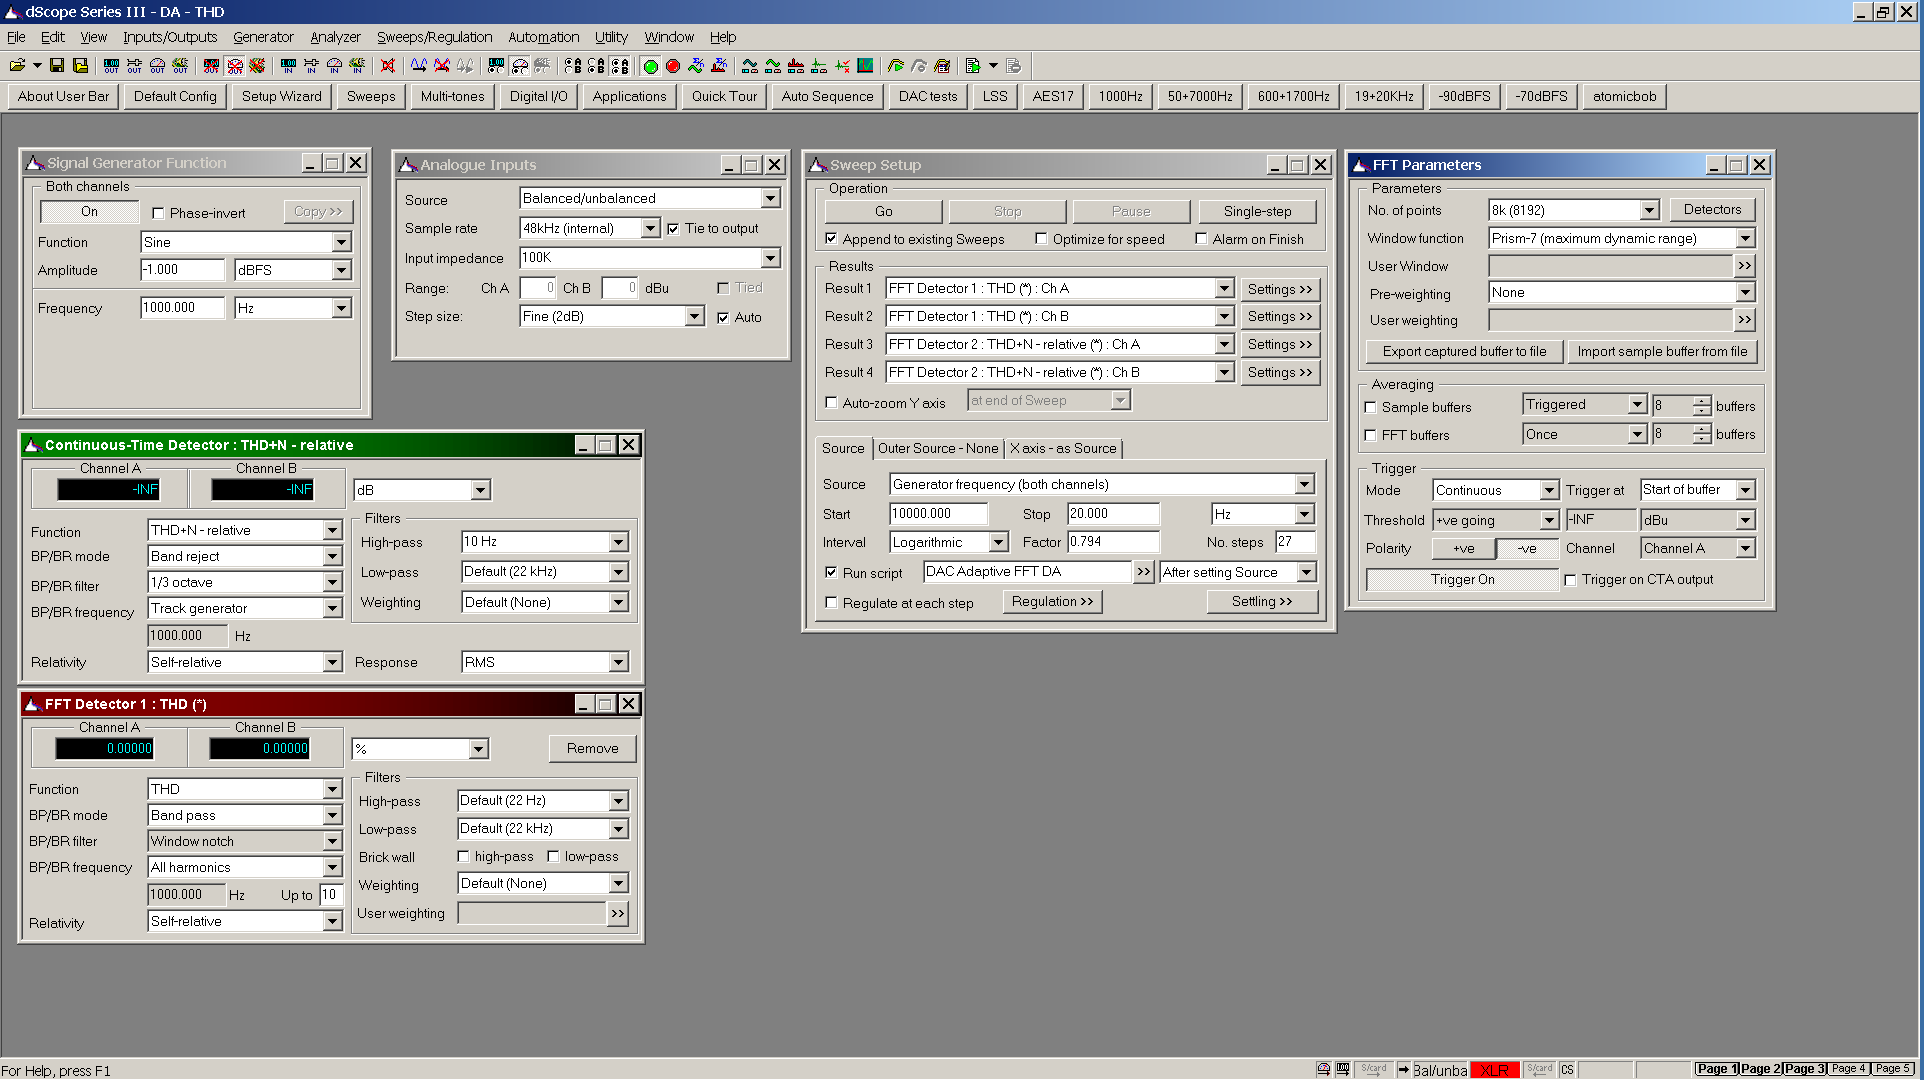
To obtain the graph a sinusoid is swept from 20 Hz to 20 KHz, measuring and plotting the THD and THD+N

Sample at 300 Hz above. Sample at 1000 Hz below.

Sample at 3000 Hz.

The graph for this device indicates a frequency neutral THD and THD+N. Residual noise observed is low as depicted in the spectrum with the primary residual noise being power supply mains related. However, given -90 dBu translates to 10 dB SPL for an HD800 this should remain inaudible.

The graph for this device indicates a frequency dependent THD with distortion rising as frequency falls. THD+N is frequency neutral but overall higher than the previous example. Also note the number of spikes in the spectrum. Residual noise (blackground) observed is noisier compared to the previous device measurement. (Please watch the y axis notation – this graph has different scales than the previous examples.)
Further reading:
Fundamentals of Modern Audio Measurements, Richard C. Cabot
http://www.aes.org/e-lib/browse.cfm?elib=7080
THD less than 0.02%
THD less than 0.02% at 1 KHz
THD less than 0.02%, 20 Hz to 20 KHz, 0 dBu, 300R load
The first specification is meaningless. It provides no information about the measurement conditions. The second is a little better acknowledging THD was measured at a single frequency with no level or load specified. It is not very useful unless you listen primarily to 1 KHz sinusoids. The third specification provides the frequency range over which the measurements were acquired, the voltage level and load used. This is a much more complete and honest specification. Yet greater insight may be derived from viewing the graph which produced that last specification.
Acronyms
THD = Total Harmonic Distortion
THD+N = Total Harmonic Distortion + Noise
dBu = dB referenced to 0.775 Vrms
Consider the following example:
Points of interest
1. Fundamental 300 Hz sinusoid at -26.55 dBu
2. 2nd harmonic 600 Hz sinusoid at -96.22 dBu
3. Calculated THD for 300 Hz both numeric display and point on graph
4. Calculated THD+N for 300 Hz, numeric display and point on graph
5. 60 Hz mains noise at -90 dBu
6. 180 Hz mains noise at -105 dBu
THD adds the dB levels of 2nd and higher harmonics of the fundamental input sinusoid found in the FFT, and compares the result to the fundamental in the FFT.
THD+N adds dB levels of everything in the FFT except the fundamental, and compares to the fundamental, which typically results in a larger number due to inclusion of noise.
Here are some useful equations.
To obtain the graph a sinusoid is swept from 20 Hz to 20 KHz, measuring and plotting the THD and THD+N
Sample at 300 Hz above. Sample at 1000 Hz below.
Sample at 3000 Hz.
The graph for this device indicates a frequency neutral THD and THD+N. Residual noise observed is low as depicted in the spectrum with the primary residual noise being power supply mains related. However, given -90 dBu translates to 10 dB SPL for an HD800 this should remain inaudible.
The graph for this device indicates a frequency dependent THD with distortion rising as frequency falls. THD+N is frequency neutral but overall higher than the previous example. Also note the number of spikes in the spectrum. Residual noise (blackground) observed is noisier compared to the previous device measurement. (Please watch the y axis notation – this graph has different scales than the previous examples.)
Further reading:
Fundamentals of Modern Audio Measurements, Richard C. Cabot
http://www.aes.org/e-lib/browse.cfm?elib=7080
