antonyfirst
Headphoneus Supremus
This will help lots of us to put our impressions in perspective, and give some more objective information to other people.
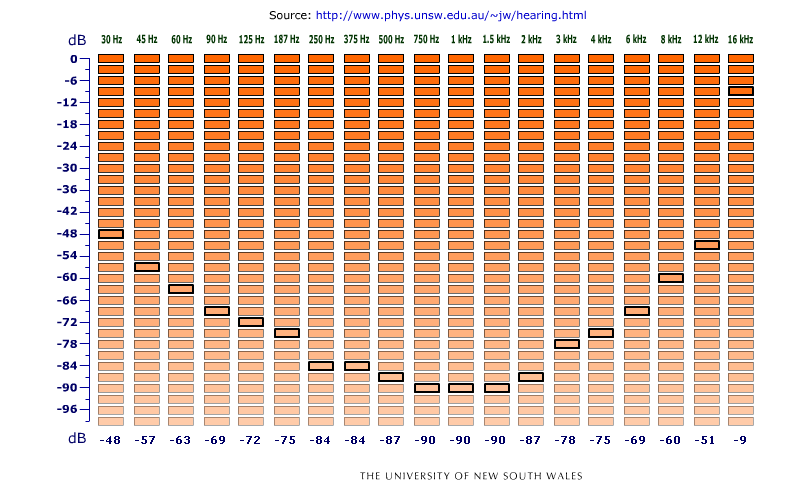
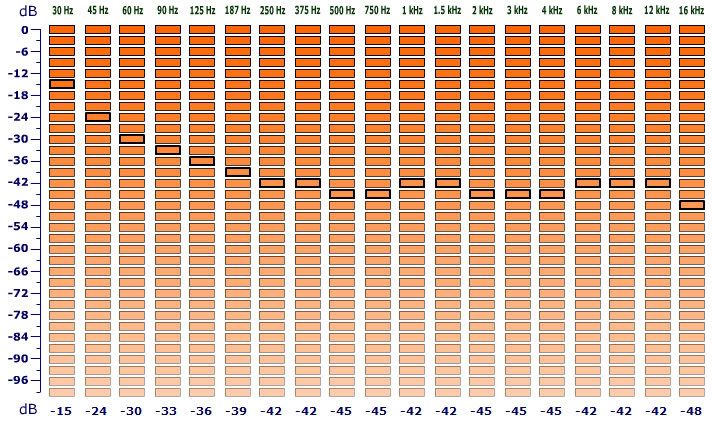
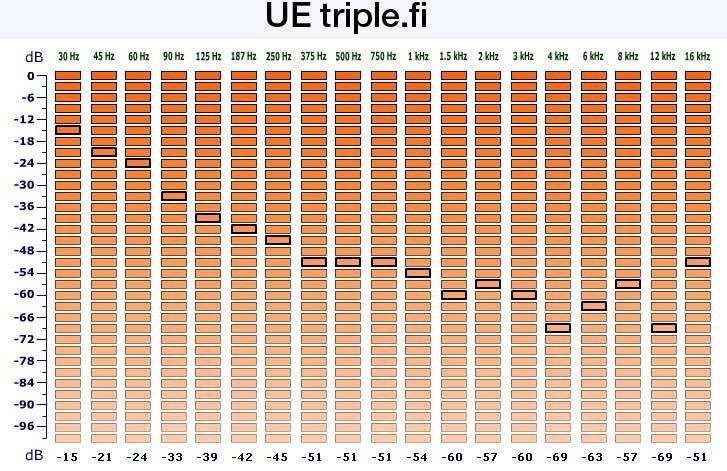
Equal loudness contours and audiometry - Test your own hearing
The graph works this way: you play different notches for each frequency, with your headphones on, and you can state the loudness curve of your headphones to your ears.
The lower you go, for each column, the lower volume will be played by your computer. So you, an headphone that lets you hear well at a low value is very sensitive to that volume.
If you flip the resulting curve, you have a frequency response like those shown at Headroom.
Let's do a try:

Like I stated many times before, the RE1 have soft treble (relaxed rather than exciting), suppressed upper midrange (6kHz) which results in muted cymbals (not so good) and total forgiveness to sibilance (good). They have full vocals (a bit chesty sometimes), and fat, deep bass, that wouldn't be out of proportion if they had better upper midrange.

I described the OK2 like having great treble, crystal clear vocals and good detail. Some slight sibilance with harsh recordings, but a very flat and enjoyable sound overall. I didn't realize that bass was so severely rolled off. There's no midbass bloat (good), nor shaky deep bass (bad). The latter feature has to be expected for an earbud design.
The graph goes up to 16 kHz, so it's thought better for IEMs/earphones than full size headphones, that usually reach higher.
This is the right way to take a reference volume:
Quote:
Important!!!
To save the image, press the "Stamp" key on your keyboard, it will take an image of the screen. Then open Paint and paste the screenshot in it. Crop the region of interest and upload it somewhere (photobucket, flickr, please don't use imageshack since many of us are having problems viewing images at their full size).
Equal loudness contours and audiometry - Test your own hearing
The graph works this way: you play different notches for each frequency, with your headphones on, and you can state the loudness curve of your headphones to your ears.
The lower you go, for each column, the lower volume will be played by your computer. So you, an headphone that lets you hear well at a low value is very sensitive to that volume.
If you flip the resulting curve, you have a frequency response like those shown at Headroom.
Let's do a try:
Like I stated many times before, the RE1 have soft treble (relaxed rather than exciting), suppressed upper midrange (6kHz) which results in muted cymbals (not so good) and total forgiveness to sibilance (good). They have full vocals (a bit chesty sometimes), and fat, deep bass, that wouldn't be out of proportion if they had better upper midrange.
I described the OK2 like having great treble, crystal clear vocals and good detail. Some slight sibilance with harsh recordings, but a very flat and enjoyable sound overall. I didn't realize that bass was so severely rolled off. There's no midbass bloat (good), nor shaky deep bass (bad). The latter feature has to be expected for an earbud design.
The graph goes up to 16 kHz, so it's thought better for IEMs/earphones than full size headphones, that usually reach higher.
This is the right way to take a reference volume:
Quote:
| Originally Posted by MaloS In the 1 kHz column, choose a panel about halfway down. Listen to it and check that (i) it is not uncomfortably loud and (ii) it is considerably louder than the background noise. Go up or down the column if necessary until these conditions are satisfied. Notice that the dB level chosen is now recorded at the bottom of the chart. Once you have made a choice, this becomes your reference sound. |
Important!!!
To save the image, press the "Stamp" key on your keyboard, it will take an image of the screen. Then open Paint and paste the screenshot in it. Crop the region of interest and upload it somewhere (photobucket, flickr, please don't use imageshack since many of us are having problems viewing images at their full size).