Quote:
Originally Posted by myinitialsaredac /img/forum/go_quote.gif
I hate to be quoting wikipedia but "White noise is a random signal (or process) with a flat power spectral density. In other words, the signal contains equal power within a fixed bandwidth at any center frequency."
|
Yes, I know this. The point being the bandwidth (range of frequencies) used as I mentioned before.
Quote:
| As is the nature in our world that it cannot be completely random, it was in fact limited to the audioband. |
So you set the generator to generate white noise with a bandwidth of ~ 20khz (the conservative audio spectrum) , that is good, thanks.
Quote:
| At 100MS/s I am under the impression that I am seeing parts of the original wave even at the 50ns window. |
Ah, sorry, some confusion here, I thought you were referring to the frequency of the test signal generated by the signal generator not the frequency that the scope uses for sampling, sorry if I did not make this distinction.
Technically yes, but here comes the but, but you created a signal with a bandwidth of 20khz. No single frequency in that signal exceeds 20Khz. No addition of the the frequencies will give you a waveform whose frequency exceeds 20khz. What you get is a very very complex waveform but still not greater than 20khz.
here is a simple example of wave addition
So take this "20K complex wave" and stretch it out and in terms of your scope it becomes practically invisible, i.e your 50ns window shows precisely 0.001 waves of the original waveform. It does not matter how frequently your scope samples the 20khz input other than it will give you a finer display.
Freq........Window........waves visible
1...........1S............1
20,000......1s............20,000
20,000......0.5s..........10,000
20,000......50ms..........1,000
20,000......50ns..........0.001
Quote:
| Before you did say that "at 100mhz each sample is 10ns and you have a 50ns window so you get ~ 5." |
See above
Quote:
| Which makes sense because you have 100 million samples per second and you are looking at 50ns of that. |
See above , you scope sampling frequency does not alter how much of the wave you see in a 50ns window, it does give you a more fine display of it.
Quote:
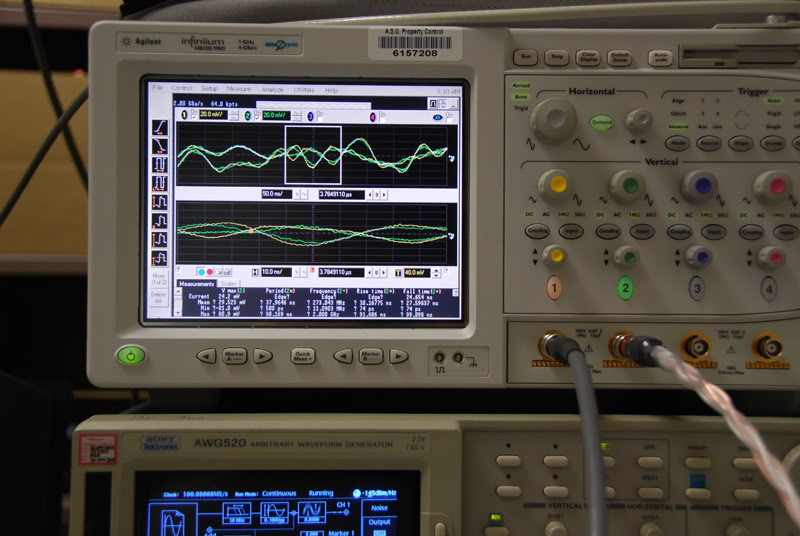
Either way if you are looking at the noise of the cable or parts of the audio waveforms the electrical differences still exist, however as is the nature of the inquisitive mind I would like to understand a lot more of what I am seeing.
Dave |
Yes, agreed the images do show a difference in noise.