
myinitialsaredac
1000+ Head-Fier
- Joined
- Sep 14, 2008
- Posts
- 1,337
- Likes
- 13
Electrical Waveform Lab
Reading the many debates on the impact interconnects can have in an audio chain yields that there is little quantitative data on the subject. My goal is to set up a scientific experiment to show whether or not there are differences amongst interconnects using quantitative data. Below I have listed a lab report style format (based on the AP guidelines) for the lab. If there is distortion (defined as changes of the original waveform) caused by interconnects this lab is not meant to determine why it occurs, merely to determine if it occurs.
Question/Purpose: Do cables make a difference in an audio chain by affecting the electrical wave passing through them? The purpose of this lab is to answer the question using quantitative data and to publish the results.
Hypothesis: The hypothesis for this lab states "If amongst different interconnects the electrical waveforms differ from one another than cables can have an effect on an audio chain because they pass along electrical waveforms differently".
Variables for this lab are as follows:
Independent variable: the various interconnects
Dependent variable: Electrical waveform measured by the oscilloscope after being passed through the interconnect
Controlled variables: White noise (random noise), the BNC to RCA adaptors, the length of the interconnects, the oscilloscope, the pulse generator, the time period (50ns and 10ns for the top and bottom windows respectively).
The equipment in the list is derived from communications made with George Cardas (CEO of Cardas Cables Welcome to Cardas Audio), Mike Olsen (Technical Advisor at Headroom HeadRoom - Right Between Your Ears), and from the input of members of the Head-Fi community (http://www.head-fi.org/forums/f133/r...tudent-368745/) supplemented by my own research. The theory behind the equipment is to create an experiment that yields germane results on the audio chain. Bit-resolution is important in all of the equipment because it is directly related to the dynamic range which needs to be as high as possible. Resistors in the chain will replicate the electrical resistance of the amplifier and DAC (digital to analog converter) circuits in the audio chain giving more pertinent results.
Equipment List:
Agilent Ininiium 54832D MSO oscilloscope (1 GHz bandwidth, 4 GSa/s sample rate)

Sony Tektronix AWG520 waveform generator

Various interconnects from supporters/donors.
3 BNC to RCA adapters
1 RCA to Dual RCA adapter
Procedures:
1) Set up the oscilloscope, pulse generator, and audio analyzer, attaching the BNC to RCA adapters to the inputs.
2) Test the interconnects with white noise and measure the electrical waveforms after passing through the interconnect
3) Photograph the waveforms after being passed against one another in order to quantify and record results and show differences
If you are interested in supporting or donating to this experiment please look at this thread - http://www.head-fi.org/forums/f133/i...rm-lab-374657/
Regards,
Dave
(Please do not discuss opinions of cable differences inside of this thread, this thread is only for this scientific experiment and I would like to keep arguments away from it. You are all welcome to support, comment, or critique on the experiment and experimental procedures. What I hope to do is create quantifiable evidence whether it supports the hypothesis or not and create an experiment that can be recreated by all who are interested.)
(TIME LAPSE)
Results (also posted later in this thread):
Hello all,
I went down to the electrical engineering labs yesterday(December 8th) to finish my electrical waveforms experiment. I want to start off by discussing a bit of my procedures before I reveal the results.
Firstly for equipment I ended up using an Agilent Ininiium 54832D MSO oscilloscope and a Sony Tektronix AWG520 waveform generator. I started off by testing the two ALO B (ALO sparrows) side by side to make sure the waves were even. I did this using a ten khz triangle wave.

(ALO B against ALO B 10khz triangle)
Everything was checking out fine. I also tried with a 10khz square wave (not restricted to audio band) and a 10khz sine wave. I then started to switch up the cables, leaving in the sparrow and first trying it against the unknown make white cable which gave me some shocking results with the 10khz sine wave. They were almost identical waveforms. I hit it with square waves and triangle waves even outside of the audio band and could not quantify enough differences to say there was one.
I remembered discussing that music is far more complex than such simple waveforms and decided to test white noise to simulate that complexity. There was a very marked difference between the ALO A (SXC?) cable and the unknown make white cable. I tried all of the cables, starting with the ALO A against the other ALO A to verify accuracy (everything checked out) and then left in one ALO A and swapped in all of the other cables. What I found is that some of the cables tested very closely to the ALO A whilst other tested very differently.

(ALO A against ALO A)
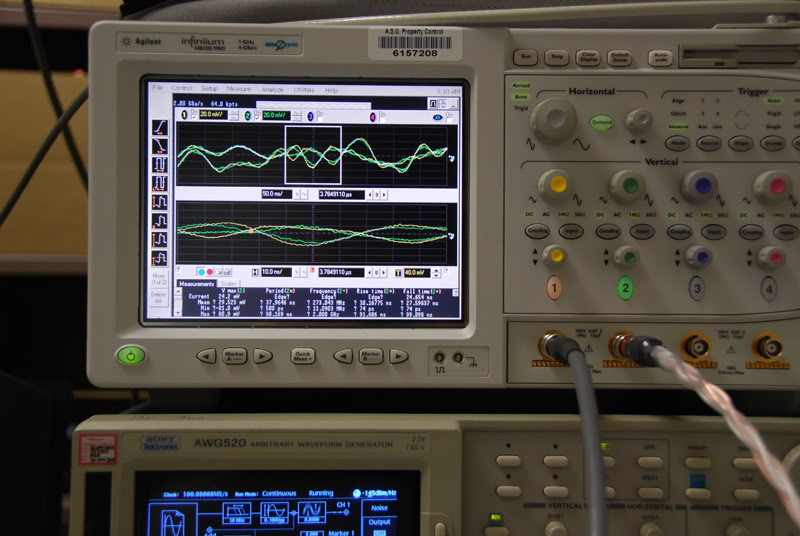
Let me take some time to explain how this worked. I used a bnc to rca adapter coupled with an rca to dual rca adapter out of the waveform generator in order to send the exact same signal to each channel. I tested the ALO A against ALO A in order to ensure the splitter was not causing any differences. The first channel is yellow and the second channel is green. When the wave appears completely white that means that each channel is equal, so no yellow or green is showing. When there is a difference you will be able to see yellow and green separately meaning the waves are not equal. I was unable to calculate a magnitude due to the nature of white noise being almost completely random and because it changes so quickly. In these tests the upper window is a 50ns clip of the wave and the bottom window is a 10ns clip of the wave.
Testing closely to the ALO A (SXC) were: Nordost Red Dawn, Nordost Blue, Nordost Black Knight, Nordost Purple, Nordost BlueRed, the Kabula Sosna, and the paper clip IC.

(Paper clip IC against ALO A)
The ones that tested extremely closely to the ALO A (SXC) were: the Red Prototype cable, the ALO B (Sparrow) and the Cardas Reference.

(ALO A against ALO B)
Those that tested very differently to the ALO A (SXC) were: the unknown make white cable, the Cardas 300 micro-b.

(ALO A against Cardas 300 micro-b)
Each cable showed differences against one another (exempt pairs of the same cable) in these tests.
I also took a look at having the cables plugged into the oscilloscope and one end free in the air and noted RFI. Again, some cables showed a lot of RFI others showed almost nil.

(Unknown make white cable)
I did this with one end unplugged because the magnitude of the RFI increased substantially in all tests. However I also tested them as a circuit with no wave running through and all of those that tested to RFI unplugged showed RFI as a circuit, however not nearly on the same order.
The ones that showed a lot of RFI were the: Unknown make white cable, the paper clip ICs, and all of the Nordost Cables.
The ones that showed some RFI were: the ALO B (Sparrow) and the ALO A (SXC).
The ones that showed almost none were: the Cardas Reference, Cardas 300 Micro-B, the Red Prototype, and the kabula sosna.
Again the cables tested differently amongst one another.
Out of curiosity I tested the Cardas Reference against the Red Prototype and they tested extremely closely.

(Cardas Reference against Red Prototype)
As you can see the line is almost completely white
Whilst the white unknown cable tested quite differently:

(Cardas Reference against unknown make white cable)
As you can see the distinct yellow and green waveforms.
I have attached 31 pictures at 800x600 for you to look at of my testing protocol and results. You can find all of them in a photobucket album here- Electrical Waveform Lab Results and Testing Photos. The camera caught some ghosting but look at the line that has a higher contrast for the current line. Yellow is channel one, green is channel two. In most of the tests the ALO A (SXC) was in channel two.
If the cables move along the electrical waveforms of random (white) noise amongst one another differently and tested differently to RFI as shown in this experiment, than there is a difference amongst cabling. Now saying that, I am unable to say what cable sounds the “best” and also how they sound different. I am also unable to say if the differences are audible. What I am able to tell you is that yes, different cables pass along electrical waveforms differently meaning that it is quite possible for the differences to be audible and thusly for cables to sound different.
I will be working on a project to qualify these results and to test if the differences that I found are audible. More on that to come however!
Thanks to all who expressed interest and participated in this experiment,
Dave
Reading the many debates on the impact interconnects can have in an audio chain yields that there is little quantitative data on the subject. My goal is to set up a scientific experiment to show whether or not there are differences amongst interconnects using quantitative data. Below I have listed a lab report style format (based on the AP guidelines) for the lab. If there is distortion (defined as changes of the original waveform) caused by interconnects this lab is not meant to determine why it occurs, merely to determine if it occurs.
Question/Purpose: Do cables make a difference in an audio chain by affecting the electrical wave passing through them? The purpose of this lab is to answer the question using quantitative data and to publish the results.
Hypothesis: The hypothesis for this lab states "If amongst different interconnects the electrical waveforms differ from one another than cables can have an effect on an audio chain because they pass along electrical waveforms differently".
Variables for this lab are as follows:
Independent variable: the various interconnects
Dependent variable: Electrical waveform measured by the oscilloscope after being passed through the interconnect
Controlled variables: White noise (random noise), the BNC to RCA adaptors, the length of the interconnects, the oscilloscope, the pulse generator, the time period (50ns and 10ns for the top and bottom windows respectively).
The equipment in the list is derived from communications made with George Cardas (CEO of Cardas Cables Welcome to Cardas Audio), Mike Olsen (Technical Advisor at Headroom HeadRoom - Right Between Your Ears), and from the input of members of the Head-Fi community (http://www.head-fi.org/forums/f133/r...tudent-368745/) supplemented by my own research. The theory behind the equipment is to create an experiment that yields germane results on the audio chain. Bit-resolution is important in all of the equipment because it is directly related to the dynamic range which needs to be as high as possible. Resistors in the chain will replicate the electrical resistance of the amplifier and DAC (digital to analog converter) circuits in the audio chain giving more pertinent results.
Equipment List:
Agilent Ininiium 54832D MSO oscilloscope (1 GHz bandwidth, 4 GSa/s sample rate)
Sony Tektronix AWG520 waveform generator
Various interconnects from supporters/donors.
3 BNC to RCA adapters
1 RCA to Dual RCA adapter
Procedures:
1) Set up the oscilloscope, pulse generator, and audio analyzer, attaching the BNC to RCA adapters to the inputs.
2) Test the interconnects with white noise and measure the electrical waveforms after passing through the interconnect
3) Photograph the waveforms after being passed against one another in order to quantify and record results and show differences
If you are interested in supporting or donating to this experiment please look at this thread - http://www.head-fi.org/forums/f133/i...rm-lab-374657/
Regards,
Dave
(Please do not discuss opinions of cable differences inside of this thread, this thread is only for this scientific experiment and I would like to keep arguments away from it. You are all welcome to support, comment, or critique on the experiment and experimental procedures. What I hope to do is create quantifiable evidence whether it supports the hypothesis or not and create an experiment that can be recreated by all who are interested.)
(TIME LAPSE)
Results (also posted later in this thread):
Hello all,
I went down to the electrical engineering labs yesterday(December 8th) to finish my electrical waveforms experiment. I want to start off by discussing a bit of my procedures before I reveal the results.
Firstly for equipment I ended up using an Agilent Ininiium 54832D MSO oscilloscope and a Sony Tektronix AWG520 waveform generator. I started off by testing the two ALO B (ALO sparrows) side by side to make sure the waves were even. I did this using a ten khz triangle wave.
(ALO B against ALO B 10khz triangle)
Everything was checking out fine. I also tried with a 10khz square wave (not restricted to audio band) and a 10khz sine wave. I then started to switch up the cables, leaving in the sparrow and first trying it against the unknown make white cable which gave me some shocking results with the 10khz sine wave. They were almost identical waveforms. I hit it with square waves and triangle waves even outside of the audio band and could not quantify enough differences to say there was one.
I remembered discussing that music is far more complex than such simple waveforms and decided to test white noise to simulate that complexity. There was a very marked difference between the ALO A (SXC?) cable and the unknown make white cable. I tried all of the cables, starting with the ALO A against the other ALO A to verify accuracy (everything checked out) and then left in one ALO A and swapped in all of the other cables. What I found is that some of the cables tested very closely to the ALO A whilst other tested very differently.
(ALO A against ALO A)
Let me take some time to explain how this worked. I used a bnc to rca adapter coupled with an rca to dual rca adapter out of the waveform generator in order to send the exact same signal to each channel. I tested the ALO A against ALO A in order to ensure the splitter was not causing any differences. The first channel is yellow and the second channel is green. When the wave appears completely white that means that each channel is equal, so no yellow or green is showing. When there is a difference you will be able to see yellow and green separately meaning the waves are not equal. I was unable to calculate a magnitude due to the nature of white noise being almost completely random and because it changes so quickly. In these tests the upper window is a 50ns clip of the wave and the bottom window is a 10ns clip of the wave.
Testing closely to the ALO A (SXC) were: Nordost Red Dawn, Nordost Blue, Nordost Black Knight, Nordost Purple, Nordost BlueRed, the Kabula Sosna, and the paper clip IC.
(Paper clip IC against ALO A)
The ones that tested extremely closely to the ALO A (SXC) were: the Red Prototype cable, the ALO B (Sparrow) and the Cardas Reference.
(ALO A against ALO B)
Those that tested very differently to the ALO A (SXC) were: the unknown make white cable, the Cardas 300 micro-b.
(ALO A against Cardas 300 micro-b)
Each cable showed differences against one another (exempt pairs of the same cable) in these tests.
I also took a look at having the cables plugged into the oscilloscope and one end free in the air and noted RFI. Again, some cables showed a lot of RFI others showed almost nil.
(Unknown make white cable)
I did this with one end unplugged because the magnitude of the RFI increased substantially in all tests. However I also tested them as a circuit with no wave running through and all of those that tested to RFI unplugged showed RFI as a circuit, however not nearly on the same order.
The ones that showed a lot of RFI were the: Unknown make white cable, the paper clip ICs, and all of the Nordost Cables.
The ones that showed some RFI were: the ALO B (Sparrow) and the ALO A (SXC).
The ones that showed almost none were: the Cardas Reference, Cardas 300 Micro-B, the Red Prototype, and the kabula sosna.
Again the cables tested differently amongst one another.
Out of curiosity I tested the Cardas Reference against the Red Prototype and they tested extremely closely.
(Cardas Reference against Red Prototype)
As you can see the line is almost completely white
Whilst the white unknown cable tested quite differently:
(Cardas Reference against unknown make white cable)
As you can see the distinct yellow and green waveforms.
I have attached 31 pictures at 800x600 for you to look at of my testing protocol and results. You can find all of them in a photobucket album here- Electrical Waveform Lab Results and Testing Photos. The camera caught some ghosting but look at the line that has a higher contrast for the current line. Yellow is channel one, green is channel two. In most of the tests the ALO A (SXC) was in channel two.
If the cables move along the electrical waveforms of random (white) noise amongst one another differently and tested differently to RFI as shown in this experiment, than there is a difference amongst cabling. Now saying that, I am unable to say what cable sounds the “best” and also how they sound different. I am also unable to say if the differences are audible. What I am able to tell you is that yes, different cables pass along electrical waveforms differently meaning that it is quite possible for the differences to be audible and thusly for cables to sound different.
I will be working on a project to qualify these results and to test if the differences that I found are audible. More on that to come however!
Thanks to all who expressed interest and participated in this experiment,
Dave

