Human Sound Perception vs. Full Dynamic Range

Apr 17, 2025 at 4:42 PM Post #16 of 28
As usual, gregorio's misinformation needs to be corrected.
First lie: Perception of loudness is a complete red herring; it’s entirely possible to have no perception of loudness at all (a perception of silence) and yet the sound still be “hazardous to your hearing”. For example, a very high sound pressure level (SPL) at ultrasonic frequencies. Perception of loudness is irrelevant to the hazard, what has been clearly demonstrated (for many decades) to be hazardous is the average SPL over time. The higher the SPL, the shorter the duration required to be hazardous (potentially cause Noise Induced Hearing Loss, NIHL). This leads on to the …
Ultrasonic frequencies are a total red herring in this context. the article is not about industrial ultrasound hazards...it’s about human-audible content in recorded music. It discusses transient peaks in audio you can hear. Pullingin silent-but-dangerous ultrasonic examples to argue against a headphone article about jazz recordings is like arguing that stairs are dangerous because airplanes crash.
Second lie: If the peak level of a recording is 130dB, then the average level will be no lower than approximately 112dB (typically) in the case of classical music recordings and around 122dB (typically) for popular music genres,
This is flat-out wrong. Peak-to. -average ratios for well-mastered music can be 15–25 dB or more. A 130 dB peak does not imply an average of 122 dB. That would be physically painful and completely unlistenable. Most pop music has peaks at 100–105 dB with averages in the 85–90 dB range. Classical music often has 20+ dB of headroom. The article didn’t suggest listening to music at 130 dB—it referenced what’s required to cleanly reproduce the occasional transient spike without clipping. That’s the entire point of headroom
 
Last edited:
Apr 17, 2025 at 5:57 PM Post #17 of 28
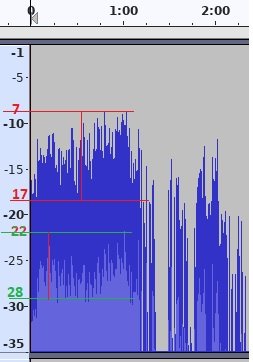
Here's the track from the article (captured from youtube) but with both axes included:

black.arthurs.bounce.lin.png


And here with y-axis changed to dB scale:

black.arthurs.bounce.db.png
 
Apr 18, 2025 at 3:13 PM Post #18 of 28
As usual, gregorio's misinformation needs to be corrected.
How do you manage it? Considering the number of times you’ve claimed I’m wrong, just the law of averages should ensure you’re right at least once or twice but you manage to be wrong and make a fool of yourself every single time without fail, quite a feat! What I don’t get is why, most sane people would give up after making a fool of themselves just once, maybe a few would make a fool of themselves two or even three times before it sinks in, but you just keep going, time and time again.
Ultrasonic frequencies are a total red herring in this context. the article is not about industrial ultrasound hazards...it’s about human-audible content in recorded music.
Your typical BS. If you’d bothered to read the quote and my response or even some of the responses from others, probably even you could have worked out the context was about falsely correlating hazardous levels and a perception of loudness. Ultrasonic frequencies create no perception of loudness, even at hazardous levels and therefore refutes the (false) assertion. Duh!
This is flat-out wrong. Peak-to. -average ratios for well-mastered music can be 15–25 dB or more. …
The peak to average (RMS) ratio is called the “Crest Factor”. This paper published in the AES Journal 2014 analysed the top 100 hits of each year from 1967 - 2011, 4,500 tracks in total and states: “Indeed, from our 4,500 track corpus, only 18 tracks posses a crest factor that’s equal or above 15dB”! Maybe you’re now going to claim there’s only 18 tracks that were “well-mastered” from 1967 - 2011? lol
Classical music often has 20+ dB of headroom.
Headroom, what are you talking about? There is not one single commercial classical music recording with “20+ dB of headroom”. Don’t you even know what “headroom” is? If you mean ”crest factor”, then surprise, surprise, wrong again! As The Dynamic Range Database measures crest factor, I typed “orchestra” into the “artist” field and scanned through the first 40 pages or so, about 600 recordings of orchestral music; some had a crest factor as low as 10dB but most were in the range of 13-16dB, a handful had 18dB, two had 19dB and two 20dB, none above 20dB! Anyone can check for themselves.

Oh dear, made a fool of yourself again!

G
 
Last edited:
Apr 19, 2025 at 6:28 AM Post #19 of 28
This is flat-out wrong. Peak-to. -average ratios for well-mastered music can be 15–25 dB or more. A 130 dB peak does not imply an average of 122 dB. That would be physically painful and completely unlistenable. Most pop music has peaks at 100–105 dB with averages in the 85–90 dB range. Classical music often has 20+ dB of headroom. The article didn’t suggest listening to music at 130 dB—it referenced what’s required to cleanly reproduce the occasional transient spike without clipping. That’s the entire point of headroom
Peak-to-average power ratio (PAPR) is calculated by dividing the max value of squared amplitude by the squared root mean square of the signal: For digital signals we have:

PAPR.png


Since this is a power related value (crest factor squared), in decibels we have 10 * log10 (PAPR) dB. If we do this calculation for real recordings, we find out that even PAPR = 15 dB is somewhat rare and hardly any recording exceeds PAPR = 20 dB. Of course there are very quiet parts in recordings, but they contribute typically very little on the average level and those parts are supposed to sound quiet.

Who says the peaks have to be 130 dB? If a recordings happens to have PAPR = 20 dB, loudish listening level would be to have the average level be about 80 dB and the peak about 100 dB. 10 dB louder than that (average level 90 dB, peaks at 110 dB) is REALLY LOUD. Most people just don't understand decibels and what are good levels for music listening...
 
Last edited:
Apr 21, 2025 at 7:10 AM Post #20 of 28
Assuming the track is perceived as loud at an average of 85 dB as most commercially recorded music does, it’s highly unlikely that there would be any peak that reached 130 dB. The difference between 85 and 130 is massive, and the track would have to be normalized way down for the peak to even exist on a CD, resulting in a track that would be incredibly quiet compared to other commercial music.

Regardless of how a very short, very loud transient peak is perceived, it just wouldn’t be practical, and a peak that far above the average wouldn’t be allowed to exist by any competent sound engineer. Most commercially recorded music has no more than a 55-60 dB dynamic range. That’s plenty to reproduce music comfortably.
 
Last edited:
Apr 22, 2025 at 10:09 AM Post #21 of 28
Assuming the track is perceived as loud at an average of 85 dB as most commercially recorded music does, it’s highly unlikely that there would be any peak that reached 130 dB. The difference between 85 and 130 is massive, and the track would have to be normalized way down for the peak to even exist on a CD, resulting in a track that would be incredibly quiet compared to other commercial music.

Regardless of how a very short, very loud transient peak is perceived, it just wouldn’t be practical, and a peak that far above the average wouldn’t be allowed to exist by any competent sound engineer. Most commercially recorded music has no more than a 55-60 dB dynamic range. That’s plenty to reproduce music comfortably.


so in the end, Audeze, wrote an article where
1) they took a dB plot of absolute vs. rolling average of a song and stripped out the y-axis
2) made up a claim that the Y-axis actually swings from 85 to 130 dB peaks; when the peaks from @danadam posted are somewhere around 10 dB, but even if you move a few seconds over to the absolute silence and top peak it's still somewhat 25 dB (right before 2 min mark)?
3) stated that instead of 85-130 dB your brain actually perceives this to be at something like 35-55 dB, or just simply took the rolling average and claimed that that is the actual dB sound your ear hears
4) state that you need a great amp to fully drive your headphones to those 50+dB spikes so you can hear full details of the song without any clippings.


@danadam -- per what you're posting, of that song, then there's only about 10 dB raw peak vs. something like 6 dB on the "rolling average"? and at around 2 minute mark you would have an absolute range of ~25dB? otherwise i don't understand how to read that plot?
sound.jpg
 
Apr 22, 2025 at 10:38 AM Post #22 of 28
More isn’t always better. A 130dB peak in a song would be either uncomfortable, unnecessary and/or inefficient. The dynamic range in CDs is already overkill.
 
Apr 22, 2025 at 12:34 PM Post #23 of 28
1) they took a dB plot of absolute vs. rolling average of a song and stripped out the y-axis
To me all the plots in this article are clearly in linear scale, not dB scale.

per what you're posting, of that song, then there's only about 10 dB raw peak vs. something like 6 dB on the "rolling average"?
Here are some metrics from that youtube download:
Code:
Sample peak -0.45 dBFS
        RMS -23.55 dBFS
   Loudness -21.5 LUFS
        LRA 11.8 LU
  True peak -0.4 dBTP
(The forum seems to have broken "code" tag and replaces subsequent spaces with a single one :face_palm:)
and at around 2 minute mark you would have an absolute range of ~25dB? otherwise i don't understand how to read that plot?
The discussion was about peak vs RMS values, so the plot with the dB scale was zoomed to the [0,-35] dBFS range. Here's up to about -90 dBFS:

black.arthur.bounce.png


I can also include a graph of some loudness related metrics (EBU R 128):

black.arthur.bounce.loudness.png


If someone wants something to compare, here are similar plots of a few different songs: https://github.com/danadam/plot_loudness
 
Apr 23, 2025 at 6:25 AM Post #24 of 28
1) they took a dB plot of absolute vs. rolling average of a song and stripped out the y-axis
Yes but not just any random song, an extreme outlier!
2) made up a claim that the Y-axis actually swings from 85 to 130 dB peaks; when the peaks from @danadam posted are somewhere around 10 dB, but even if you move a few seconds over to the absolute silence and top peak it's still somewhat 25 dB (right before 2 min mark)?
According to the measurements posted by @danadam, the difference between the peak and average (RMS) levels is just over 23dB. So if the peak level were 130dB (SPL), then the average level would be about 107dB SPL, not 85dB as claimed/implied. To put this into context, the typical average level of consumer TV playback is around 68-74dB SPL (although this figure isn’t well substantiated), the typical average level of headphone playback is around 60-65dB SPL (which is well substantiated but is an “A” weighted figure), while the average level of normal conversation is about 50-60dB SPL. All way, way below the 107dB SPL average of their example, which they falsely claim would be 85dB but even 85dB is unrealistic as an average level and even more so for HPs!
3) stated that instead of 85-130 dB your brain actually perceives this to be at something like 35-55 dB, or just simply took the rolling average and claimed that that is the actual dB sound your ear hears
Here’s where it gets complicated, because there is no direct relationship between dB SPL and the perception of loudness, as already mentioned a few times. The figures they are suggesting are just made-up BS, with no basis in reality. Unfortunately for audeze, it is now possible to measure loudness and check their claims, although they’re banking on the fact that most audiophiles won’t have much understanding of perception vs actual levels or even that there is a measurement system for perception (of loudness).

A simplified explanation of the loudness measurement system might help, at least enough to understand the salient points of @danadam posted loudness (EBU R128] measurements. The loudness measurement is derived from the dBFS measurement with the application of a specific filter (called the “K-Weighted” filter) that mimics the human ears’ frequency response to level determination (similarly to the Fletcher-Munson Loudness Contours), as defined by the ITU’s (International Telecommunications Union) BS. 1770. The EBU R 128 danadam refers to is the European Broadcast Union’s implementation of the ITU’s BS. 1770. The result of the dBFS + K-Weighted filter is the LUFS (Loudness Units referenced to Full Scale) measurement, which is a logarithmic scale, as is the decibel scale, and was designed for easy understanding by engineers, so +1LUFS is the same relative difference as +1dB. Incidentally, there is also the ATSC (Advanced Television Systems Committee) A85, the American equivalent of EBU R128, which uses the LKFS (Loudness, K Weighted, referenced to Full Scale) measurement. Don’t let that confuse you though, they are both derived from the ITU BS.1770 and so LUFS and LKFS are effectively identical. The system includes several types of loudness perception measurements:

“Integrated” Loudness measures the perceived loudness of the whole track (or programme in the case of TV), the higher the LUFS number (closer to zero) the louder.
“Momentary” Loudness is the measurement of transient peaks derived from the average peak loudness within a 400ms window. It is not necessarily the perceived loudness of transient peaks however.
“Short-Term” Loudness is the same as “Momentary” but uses a 3 second peak average window. It is typically closer to the perceived peak level than the Momentary Loudness but not always. The difference between the peak dBFS measurement and the Short-Term Loudness measurement is effectively the “rounding-off” of perceived peaks that audeze is referring to.
“LRA” (Loudness Range) can be considered as a loudness measurement of the perceived dynamic range over the whole track/programme. However, that’s a bit of an oversimplification, it’s more complicated in reality, not least because “dynamic range” isn’t a precisely defined term and because statistical methods are used to create the LRA measurement, resulting in a measurement more like a representative average. Studies have demonstrated that while LRA is not always a precise measurement of perceived dynamic range it is far more accurate than any other available measurement and usually correlates well. LRA isn’t referenced to Full Scale, so the measurement is just given as LU (rather than LUFS) and again, the higher the number, the greater the loudness range (perceived dynamic range). A max LRA is not specified by the EBU (or the ATSC), although it is recommended not to exceed 20 LU as studies again demonstrated that exceeding this was likely to annoy a significant percentage of consumers. EG. They wouldn’t be able to hear the quietest parts or the loudest parts would be uncomfortably loud if the volume was increased to hear the quietest parts.
“dBTP” is included in the EBU R128 (and ATSC A85) specifications but isn’t a loudness/perceptual measurement. It is the measurement of the reconstructed signal level (referenced to full scale). It is effectively the same as the dBFS measurement except that it includes inter-sample peaks.

There’s some interesting observations of the example track cited by audeze, as well as the other tracks measured by danadam, if anyone is interested? This post is already too long though, so if anyone is interested I’ll put them in a subsequent post?

G
 
Last edited:
Apr 23, 2025 at 5:41 PM Post #25 of 28
There’s some interesting observations of the example track cited by audeze, as well as the other tracks measured by danadam, if anyone is interested? This post is already too long though, so if anyone is interested I’ll put them in a subsequent post?
I certainly am :)

BTW there are 3 other tracks in that ASR thread, from Dua Lipa, Hans Zimmer / Interstellar and Sibelius / Symphony No.1:
https://www.audiosciencereview.com/...dness-lufs-plotting.19296/page-3#post-1969944
https://www.audiosciencereview.com/...dness-lufs-plotting.19296/page-3#post-1972250
 
Last edited:
Apr 24, 2025 at 6:48 AM Post #26 of 28
I certainly am :)
OK, I’ll try not go into too much detail but :)

Black Arthur’s Bounce (the audeze example): What initially caught my attention from the figures was the strange combination of audio measurements and perceptual measurements; the very high peak to RMS difference (~23dB), which would typically indicate a recording with an especially large dynamic range, the exceedingly low (for music) Integrated loudness (-21.5LUFS), which would also indicate a very large dynamic range but then a LRA of just 11.9 LU which is a relatively low perceptual dynamic range. So we seem to have a contradiction. A clue to what’s going on is the range of the LRA measurement and the fact that the peak level calculated by the LRA algorithm is only -17.1LUFS, way below the actual peak. Although rare, this can occur under certain conditions, for example, a track with very little compression, containing just drumkit (or a very prominent drumkit) with a lot of cymbals/hi-hats/ride and a loudly played snare. This would almost always result in a true peak measurement that’s significantly higher than the sample peak, but in this track they’re almost identical, the mystery deepens! Actually listening to the track and seeing the footage of the recording on YouTube reveals the answer. The musicians were all recorded in isolation booths and the instruments were frequently over blown/plucked (I assume dictated by the composition), which typically produces a spray of high SPL mid freq harmonics, which is exacerbated by the fact they all have to be close mic’ed. By itself this isn’t necessarily an insurmountable problem but it does need very careful/skilful mixing in order to produce a cohesive (acoustic) mix, so the production has a “perspective” rather than actually sounding like a bunch of close mic’ed different musicians performing in different rooms. This hasn’t been done, nor does it sound as if it’s been mastered, it’s been fairly well balanced but that’s about it. It sounds like they started mixing and then just gave up, or, that it was done by an inexperienced amateur or a first year audio engineering student. It desperately needs some individual compression, EQ, better balancing and far better panning (in conjunction with judicious reverb), and then mastering! Audeze definitely had to scrape the barrel to find this one and it most definitely is not representative of typical consumer content.

Hello - Adele: Indicative (and a very well done) example of the modern “pop” music mixing/mastering paradigm; a very high LUFS, massively compressed/limited (as indicated by the small difference between Peak and Short-Term levels) but a surprisingly large LRA. This is achieved by the composition/arrangement being designed for such heavy compression (very sparsely orchestrated in places), a feature of various contemporary popular genres (rap, EDM and others) starting around 25-30 years ago. This is presumably the general/CD release. All this is also true of the “Obsessed” track by Olivia Rodrigo. I’m personally not a fan of quite so much extreme compression or the clipping but that’s the fashion, it’s what sells, what the younger generation expects/wants and therefore what the artists and labels want.

Californication: Very high integrated loudness along with a small difference between Peak and Short-Term levels but also with a very low LRA. This indicates very heavy compression/limiting but a genre/composition/arrangement not designed for it. A classic example of the loudness war.

Paper Motion: This is an interesting one! Some of the same features as the “Black Arthur’s Bounce” track, although not quite as extreme and clearly a professional mix. Low LRA, big difference between peak and Short-Term levels and a very low integrated loudness for pop/rock. I’m not sure how/why but my guess would be the prominent drumkit with a low pitched snare and a lot of cymbals, along with quite a bit of multi-band compression but confined to the low freqs where it would have far less effect on the integrated loudness.

The Dark Knight: A very large LRA almost right on the limit of the max recommended, moderate compression and an integrated loudness smack on the YouTube spec (-14.0 LUFS) . I would guess this is a master specifically made for YouTube.

Interstellar: A high integrated loudness for this type of music and moderate to heavy compression but the standout is the huge LRA. It’s common to have a huge LRA in film music because skilled film score composers will compose/orchestrate around the dialogue as opposed to just relying on the re-recording mixers to dip the level (of the music under the dialogue/Foley). This sounds more natural and professional/polished. When released as a standalone music “soundtrack”, the music will be remixed and remastered but still the orchestration/composition will typically result in a high LRA. As with the previous track, it demonstrates the technical nouse which is a hallmark of Zimmer’s work.

Sibelius: As expected for a late or post Romantic Period symphony. Low integrated loudness, light compression and LRA around the max recommended.

G
 
Last edited:
Apr 24, 2025 at 4:17 PM Post #27 of 28
Paper Motion: This is an interesting one! Some of the same features as the “Black Arthur’s Bounce” track, although not quite as extreme and clearly a professional mix. Low LRA, big difference between peak and Short-Term levels and a very low integrated loudness for pop/rock. I’m not sure how/why but my guess would be the prominent drumkit with a low pitched snare and a lot of cymbals, along with quite a bit of multi-band compression but confined to the low freqs where it would have far less effect on the integrated loudness.
Part of the reason could be, that it was produced by trptk, which is kind of an audiophile label, so it probably wasn't processed as a typical pop/rock would. In any case I like the result. It's one of my favorite albums.

For some reason the album is no longer available in their catalogue [1]. There is still a behind the scenes article:
https://trptk.com/behind-the-scenes-recording-paper-motion/

[1] but it's on bandcamp, and if someone has too much money, on nativedsd :-)
 
Apr 24, 2025 at 6:10 PM Post #28 of 28
Part of the reason could be, that it was produced by trptk, which is kind of an audiophile label, so it probably wasn't processed as a typical pop/rock would. In any case I like the result. It's one of my favorite albums.
It’s sophisticated production, still a couple of slightly strange choices (sounds like the hats and cymbals are being played “off-stage” and the lead vox are a bit too recessed) and I don’t care for all the audiophile BS in the behind the scenes article, although I realise they have a target audience to pander to. I can certainly see why you like it though, it’s a very well structured piece, eclectic but not “out there”, the band is tight and generates a good “feel” and despite my criticism it is certainly a better mix than just competent. Nice choice, I’ll listen to the rest of the album when I have time, thx!

G
 

Users who are viewing this thread

Back
Top