


JaZZ
Headphoneus Supremus
Quote:
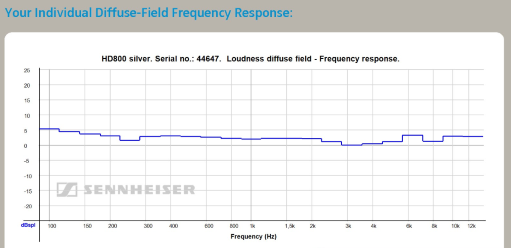
I envy you! First in Europe*, smoothest frequency response so far!
It won't be too long till I get my pair, though!
Quote:
I've heard that Switzerland will receive a select few dozens with particularly perfect frequency response. No definitive confirmation, though.

[size=xx-small]* Actually I know of a few German guys who received theirs three days ago, but who cares! [/size]
.
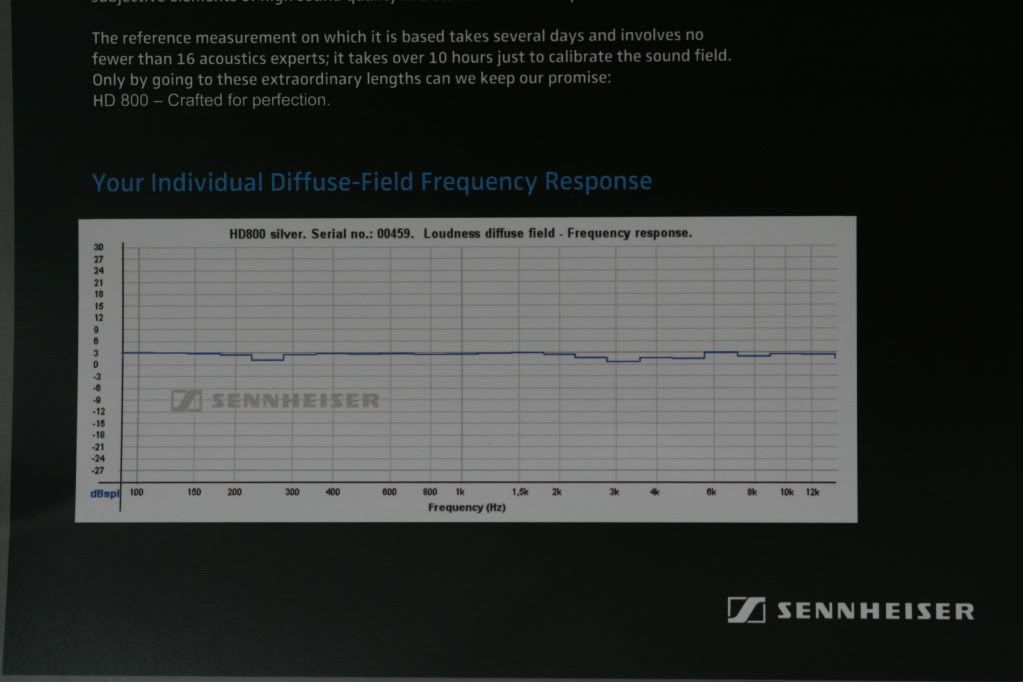
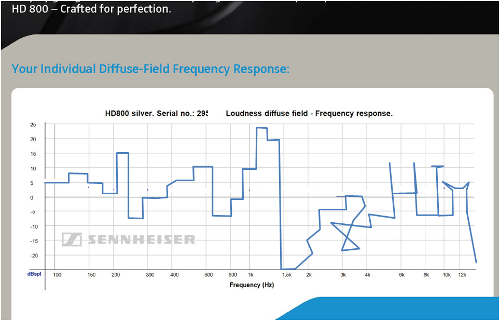
| Originally Posted by Karlosak /img/forum/go_quote.gif I too received my Sennheiser HD800 certificate today, probably I'm the first in Europe. And here is the frequency response itself: 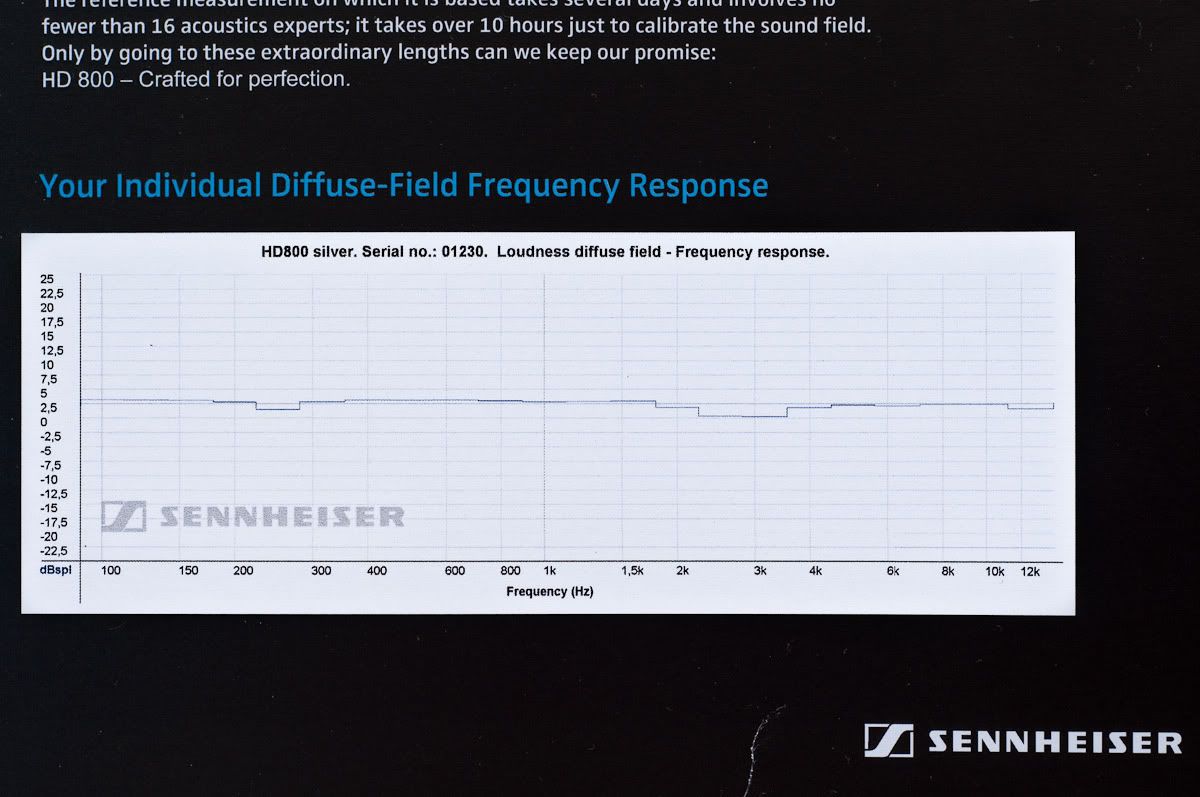
|
I envy you! First in Europe*, smoothest frequency response so far!
It won't be too long till I get my pair, though!
Quote:
| Originally Posted by DoYouRight /img/forum/go_quote.gif Does country of order affect this treble spike trend at all? Wondering where to order mine? |
I've heard that Switzerland will receive a select few dozens with particularly perfect frequency response. No definitive confirmation, though.
[size=xx-small]* Actually I know of a few German guys who received theirs three days ago, but who cares! [/size]
.