


vid
Headphoneus Supremus
- Joined
- Jan 5, 2005
- Posts
- 2,063
- Likes
- 130
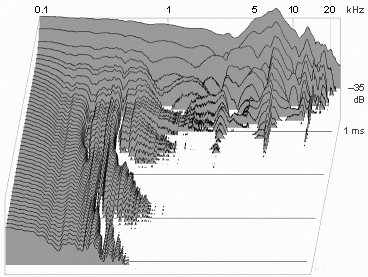
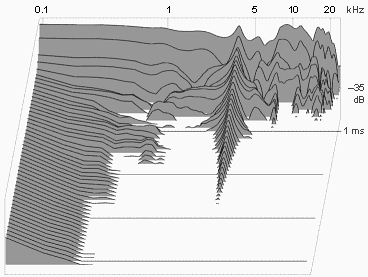
I'm not quite sure if any one of us knows what the others are discussing exactly. I certainly don't anyway. Is this still related to testing individual frequency pulses to form a map of ringing per frequency?
I'm not doubting that one gets problems cutting off a wave with one's window. Though I still don't (even after reading that article) see where the abrupt start or stop to a physical sine waves comes from if not from trying to represent it as individual samples? (Not that it matters, since we're treating our measurements digitally anyway.)
I'm not doubting that one gets problems cutting off a wave with one's window. Though I still don't (even after reading that article) see where the abrupt start or stop to a physical sine waves comes from if not from trying to represent it as individual samples? (Not that it matters, since we're treating our measurements digitally anyway.)


