[SOLVED] Question about short delay DAC Filter

May 15, 2025 at 7:13 AM Thread Starter Post #1 of 11

Vamp898

Headphoneus Supremus
Joined
Mar 5, 2020
Posts
4,222
Likes
5,147
Location
Japan
I learned, the optimal impulse response is supposed to look like this

1747307406663.png


This means, the impulse response and step response on the left side is correct, right?
1747307341741.png

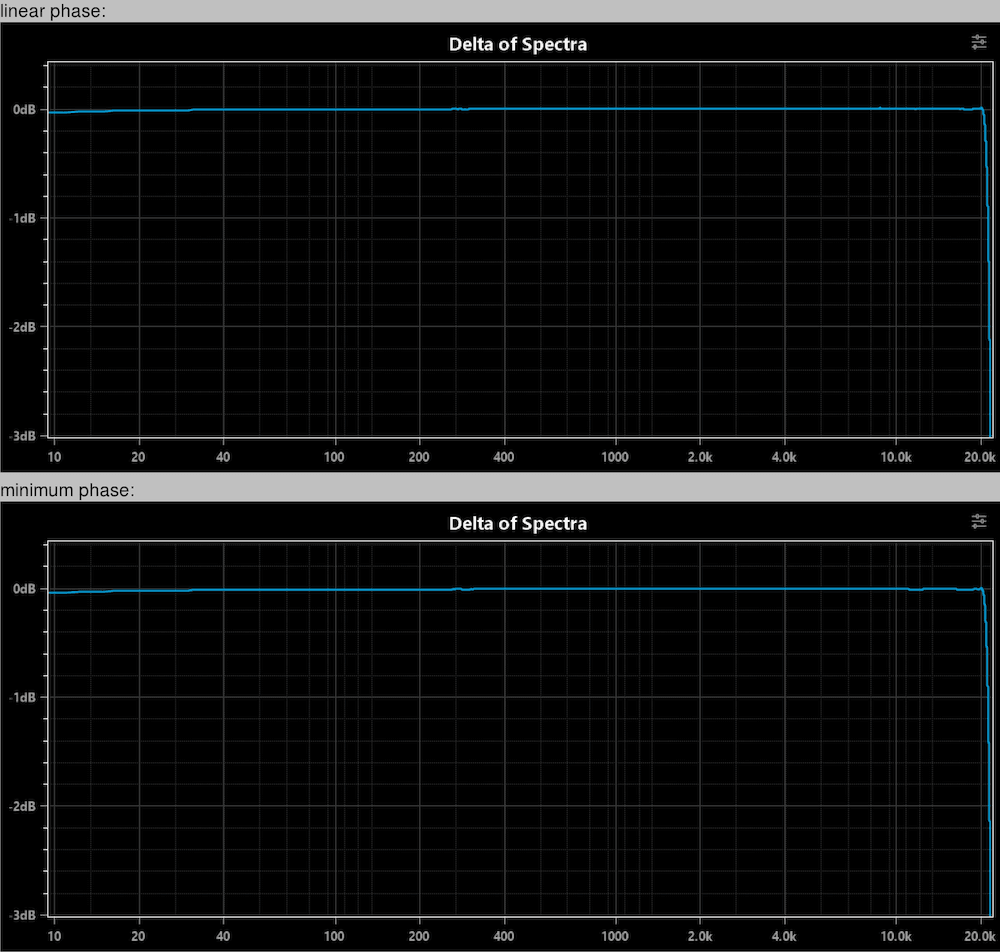
Now, because i was curious how exactly these two filters affect the actual result when playing music or white noise, i tried to measure the difference and analyze them with DeltaWave. Afterwards, i thought, why not compare both to the original source file. To my surprise, the right filter was closer.

This is the difference between the left filter and the source

スクリーンショット_20250515_185651.png

This is the result of the right filter compared to the source

スクリーンショット_20250515_185933.png

Did i misunderstood something or is this just an side effect that has nothing to do with the correctness of the filter?
 
Last edited:
May 15, 2025 at 8:43 AM Post #3 of 11
Is the result from a purely digital measurement or was there a DAC into ADC step involved?
There was an ADC involved, this is not purely digital. So i assume, that is the cause?
 
May 15, 2025 at 12:48 PM Post #4 of 11
Did you take into account the delay when doing the difference? Minimum phase filters literally have the minimum group delay for a causal filter (filter that doesn't predict the future and react to things before they happen like a Jedi). In your impulse and step response pictures you can see how the linear phase filter is shifted more to the right which means bigger group delay. Linear phase filters force bigger than necessary delay for frequencies in order to make the group delay equal for all frequencies (all frequencies need to be as slow as the slowest frequensies). Minimum phase filters on the other hand make all frequencies as "quick" as possible, but it means some frequencies pass the filter faster than others.

If you correct for the delay difference correctly, you should see that the linear phase filter is closer to the original as expected.
 
Last edited:
May 15, 2025 at 3:56 PM Post #5 of 11
After taking a look at deltawave, I'm not sure how the spectogram should be interpreted because the legend does not make sense at all. I suggest to look at the spectrum of delta and the delta phase instead. You could also export the difference into a wav file and look at it with an other spectogram such as Spek or even a VST plugin in your DAW. I'm 99% sure you will find that the minimum phase filter cancels poorly while the linear phase filter cancels virtually perfectly below the cutoff frequency. If not, then the problem isn't the misleading spectogram in deltawave but your setup instead, you unknowingly change something else as well beside the interpolation filters or the settings are incorrect for an analog measurement.
 
Last edited:
May 15, 2025 at 9:44 PM Post #6 of 11
The difference between minimum phase (or short delay) and linear phase, in the frequency domain, is in phase only. Magnitude is the same. Looking at the difference of spectrums' magnitudes won't show anything.

I took the first minute of "Daft Punk - Give Life Back to Music" (16/44k), played it through Tanchjim Space using filter 2 (minimum) and 3 (linear) (see my post on ASR for their responses) and captured with ADI-2 Pro FS (24/96k). Here's the match status:

status.png


Delta of spectrograms (I even reduced the scale to [-1, 1] dB) and delta of spectrum show no difference:

dsgram.png, ds.png

You can only see a difference on delta of phase, delta of waveform and spectrum of delta (pay attention to y-axes):

dp.png, dw.png, sd.png
 
Last edited:
May 16, 2025 at 1:54 AM Post #7 of 11
The difference between minimum phase (or short delay) and linear phase, in the frequency domain, is in phase only. Magnitude is the same. Looking at the difference of spectrums' magnitudes won't show anything.

I took the first minute of "Daft Punk - Give Life Back to Music" (16/44k), played it through Tanchjim Space using filter 2 (minimum) and 3 (linear) (see my post on ASR for their responses) and captured with ADI-2 Pro FS (24/96k). Here's the match status:


Delta of spectrograms (I even reduced the scale to [-1, 1] dB) and delta of spectrum show no difference:

,

You can only see a difference on delta of phase, delta of waveform and spectrum of delta (pay attention to y-axes):

, ,
I tested further and when playing music, i get the same result as you did. When playing White Noise, i get the initial result i posted above.

I assume white noise is, at least with the tools i have for measuring, a bit too complex to handle properly enough to show the differences i wanted to see.

Thank you for testing and verifying.

I also noticed that newer ESS DACs have two of these Filters
Linear Phase Fast Roll-Off and Linear Phase Apodizing. The Impulse response looks the same

1747374613994.png

1747374629475.png


But the frequency response looks slightly worse on the Apodizing (-117dB vs -107dB Stop Band)

1747374759767.png

1747374776271.png


I don't really get what the Apodizing is for. Also i am surprised that this one

1747374922330.png


Is the Default filter on the ES9039PRO and ES9039MPRO. I always asssumed Fast Roll-Off is the default.
 
Last edited:
May 16, 2025 at 2:46 AM Post #8 of 11
Is the "delta spectogram" not the spectogram of the difference file? Why is it sitting at 0dB for the most part of the spectrum instead of something like -80dB for linear phase below the cutoff frequency?
 
May 16, 2025 at 6:59 AM Post #9 of 11
Did i misunderstood something or is this just a side effect that has nothing to do with the correctness of the filter?
I’m not sure what you’ve measured but it doesn’t appear to be “the correctness of the filter”. There’s all sorts of potential things going on here, that may have little/nothing to do with the DAC filters. For example, the RMS difference between your ref file and the linear phase file is ~3dB, while the RMS difference between your ref file and minimum phase file is ~9dB, what is causing the ~6dB difference between your two filter recordings?
I assume white noise is, at least with the tools i have for measuring, a bit too complex to handle properly enough to show the differences i wanted to see.
If you do a null test manually, then you have to manually match the original and comparison files. You have to manually trim/align the files in time, because the start time of your loopback recording is not going to be absolutely perfect, and align the level, as the gain structure of your DAC/ADC will not match the original file’s level. DeltaWave attempts to do all this for you automatically, by analysing the features in both files (the transients and other identifiable features) and then aligning/matching them. But there’s two problems with this particular test: Firstly, white noise doesn’t have any features beyond a random pattern, which requires more complex processing to identify and Secondly, spotting a pattern in a waveform is much easier than spotting a pattern in a spectrogram. I don’t know what Deltawave is doing under the hood but I’d be mightily impressed if it could very accurately align files of only noise, based on spectrograms.
Is the "delta spectogram" not the spectogram of the difference file?
No, it’s the delta of the spectrograms. IE. The difference between the spectrogram of the original file and the spectrogram of the comparison file. The spectrogram of the difference file is available in the “Delta Spectrum” tab (rather than the “Delta Spectrogram” tab).

G
 
May 16, 2025 at 8:11 AM Post #10 of 11
Is the "delta spectogram" not the spectogram of the difference file? Why is it sitting at 0dB for the most part of the spectrum instead of something like -80dB for linear phase below the cutoff frequency?
I asked about the confusing descriptions and here's the answer from the author:
https://www.audiosciencereview.com/...comparison-software.6633/page-53#post-2306239
Delta of spectra is the difference of the two spectrum plots. I may need to adjust the description on the delta of spectrograms, as that is literally the same type of a calculation, except shown with the added time dimension.
 
Last edited:
May 16, 2025 at 8:32 AM Post #11 of 11
I asked about the confusing descriptions and here's the answer from the author:
https://www.audiosciencereview.com/...comparison-software.6633/page-53#post-2306239
Well, I’m confused! I don’t have it in front of me but I was obviously wrong about “Delta Spectrum” as that’s only the spectrum not the spectrogram, I typed that without thinking. I definitely remembered something about the Delta Spectrogram not being the spectrogram of the difference file though. Just tried searching and found what presumably triggered that memory in a message from pkane on 15/09/2019:

Delta Spectrogram actually displays the difference of the two spectrograms, and not the spectrogram of the delta waveform.

That was maybe for an older version though?

G
 

Users who are viewing this thread

Back
Top