If one inserts N zeros in between samples, as stv014 and xnor described, one can use a pair of comb filters to obtain the same result of just holding the samples. First use a feedforward comb filter with delay set to N+1 and gain set to -1. Follow this by a feedback comb filter with delay and gain set to 1 (otherwise known as an accumulator.) And voila!
Insertion of the N zeros scales the frequency axis by a factor of N and introduces some images in the spectrum, but otherwise does nothing to the magnitude and phase of the original sampled signal. Holding the value instead of inserting the zeros, effectively passes the N zero inserted signal through the pair of comb filters. These filters may attenuate the images introduced by the zero insertion process. However, the comb filters will color the signal with their own frequency response.
Originally Posted by xnor /img/forum/go_quote.gif
A very practical answer: ... If we double the sampling rate and don't insert 0 between +1 and -1 but repeat each sample (+1, +1, -1, -1 ...) we've effectively killed the new highest possible frequency - that's our null in the FR.
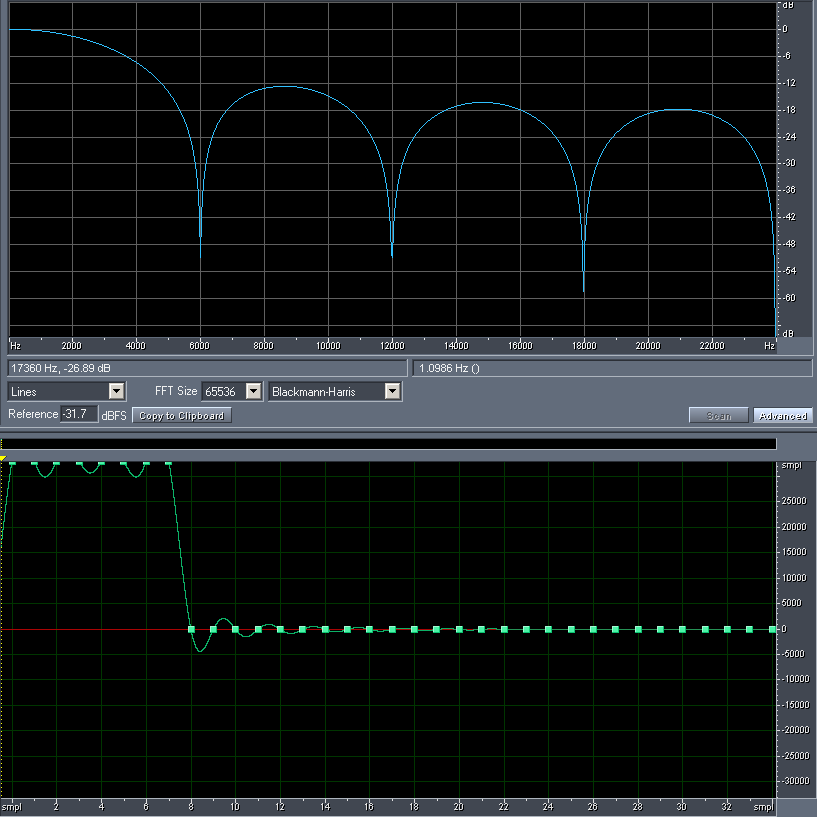
Resampling implemented - here is how my 'resample' utility performs when upsampling one minute of 13-bit MLS from 44.1 kHz to 96 kHz:
A zoomed in display of the frequency range near the Nyquist frequency:
It actually upsamples the input to 88.2 kHz first (with the already explained method of inserting zero samples, and applying a FIR lowpass filter), and then uses sinc interpolation to convert the intermediate signal to 96 kHz. The reason why it is not interpolated directly from 44.1 kHz is that it requires a much smaller window to interpolate an oversampled signal, and FFT convolution is cheaper at the same length than sinc interpolation.
The currently released version converted the file in ~2.45 s, which is not particularly great compared to the ~1.35 s that is achieved with the sox "rate" effect. However, a new version that is already being tested makes some improvements, while keeping the accuracy at least as good:
- it uses a faster (~1.5x) FFT library instead of my own code
- when up- or downsampling by an integer number of octaves, the upsampling or decimation is performed in the frequency domain as part of the FFT convolution, making one of the FFTs required for processing one block shorter. These two changes still only improve the time to ~2.2 s, however, because most of the time is spent in the sinc interpolation
- if the resample ratio is a simple rational number (something like 96000 / 44100, rather than 96001 / 44100, for example), it uses a set of pre-calculated tables for interpolation, rather than calculating the sinc function and the window directly; that speeds up the processing of the test file to ~0.99 s
For 24 bit files about 175 dB rejection should be enough, for 16 bit ones a much lower 125 dB. So by reducing rejection a bit and optimizing both filters you should be able to shorten the impulse response and further speed up the process.
It's funny how I planned on implementing a resampler plugin for fb2k a while ago using the same idea: upsample and filter quickly using FFT, then interpolate using a (much) shorter windowed sinc. But with the sox one working so nicely I never got around doing it.
For 24 bit files about 175 dB rejection should be enough, for 16 bit ones a much lower 125 dB. So by reducing rejection a bit and optimizing both filters you should be able to shorten the impulse response and further speed up the process.
Yes, what is shown above is obviously overkill in practice, although the rejection increases fast with the window size, so making it worse does not improve the performance that much. Here is what the spectrum looks like with reduced interpolation window sizes (I did not bother changing the FIR filter settings, since the speed difference is even smaller there):
The processing time was 0.965 s for -il 48 (which is the default), 0.933 s for -il 44 (~180 dB), and 0.828 s for -il 32 (~130 dB).
With an output sample rate of 96001 Hz (which disables the fast table based interpolation), the times change to 2.178 s, 2.093 s, and 1.836 s, respectively.
But the table based mode still uses a Gaussian window (which is cheap to calculate, and made sense in the slower mode that does not use tables at all), so an optimized window function could be shorter.
With an integer ratio and FFT filtering only, rejection becomes really cheap, this is the 44100 Hz to 176400 Hz conversion in ~0.91 s with a slightly longer filter:
The downloadable package (see link in my signature) has been updated, with the previously described resampler changes implemented (frequency domain upsampling/decimation with power of two resample ratios, faster table based interpolation when the ratio is non-integer, but is a reasonably "simple" rational number). Also in the resample utility, there is a new -q (quality) option for easier configuration of the parameters (-il, -fl, and -fw are automatically set based on -q and -ff, that is, the quality and the bandwidth), but the exact effect of this could still be fine-tuned in new versions.
Other changes that apply to all programs include the use of the Ooura FFT library (faster and - although this does not really matter in practice for audio - more accurate than the original code), and GCC 4.7.2. A couple of bugs have been fixed as well.
I did some tests with the most recent version. The programs compared are:
- resample.exe from the "dsputils.zip" package (compiled with GCC 4.7.2, with the optimization flags "-O2 -march=pentium3 -mtune=generic -mfpmath=sse -msse -msse2 -fomit-frame-pointer -ffast-math -DUSE_SIMD=1 -DUSE_OOURA_FFT=1"), using a filter frequency parameter of 0.48, and various "-q" settings
- the same program compiled for 64-bit Linux with GCC 4.7.1, and optimization flags "-O2 -DUSE_SIMD=1 -DUSE_OOURA_FFT=1"
- sox-14.4.0 (64-bit Linux version included with the distribution)
The input signal was 1 minute of 13-bit MLS (x^13 + x^7 + x^6 + x^5 + 1) in 44100 Hz/16-bit/2-channel format, the output format was 64-bit floating point. These are the times for the 32-bit Windows version:
Code:
22050 Hz 88200 Hz 96000 Hz 96001 Hz 176400 Hz resample -q1 0.206 s 0.491 s 0.682 s 1.571 s 0.870 s resample -q3 0.214 s 0.494 s 0.760 s 1.792 s 0.960 s resample -q5 0.212 s 0.494 s 0.827 s 1.990 s 0.919 s resample -q7 0.212 s 0.499 s 0.898 s 2.202 s 0.923 s resample -q9 0.223 s 0.517 s 0.985 s 2.330 s 0.939 s sox rate -h 0.198 s 0.460 s 1.295 s 1.288 s 2.075 s sox rate -v 0.202 s 0.465 s 1.363 s 1.721 s 2.214 s
And the somewhat faster 64-bit Linux version (sox is the same in both tables):
Code:
22050 Hz 88200 Hz 96000 Hz 96001 Hz 176400 Hz resample -q1 0.178 s 0.434 s 0.604 s 1.502 s 0.778 s resample -q3 0.188 s 0.438 s 0.687 s 1.713 s 0.807 s resample -q5 0.189 s 0.439 s 0.753 s 1.896 s 0.787 s resample -q7 0.186 s 0.442 s 0.829 s 2.074 s 0.798 s resample -q9 0.192 s 0.444 s 0.933 s 2.271 s 0.829 s sox rate -h 0.198 s 0.459 s 1.298 s 1.284 s 2.075 s sox rate -v 0.203 s 0.477 s 1.364 s 1.666 s 2.214 s
At 96001 Hz, where no tables are used for the sinc interpolation, the performance could be better (perhaps using a look-up table with cubic or similar simple interpolation), but at the other rates it is not bad.
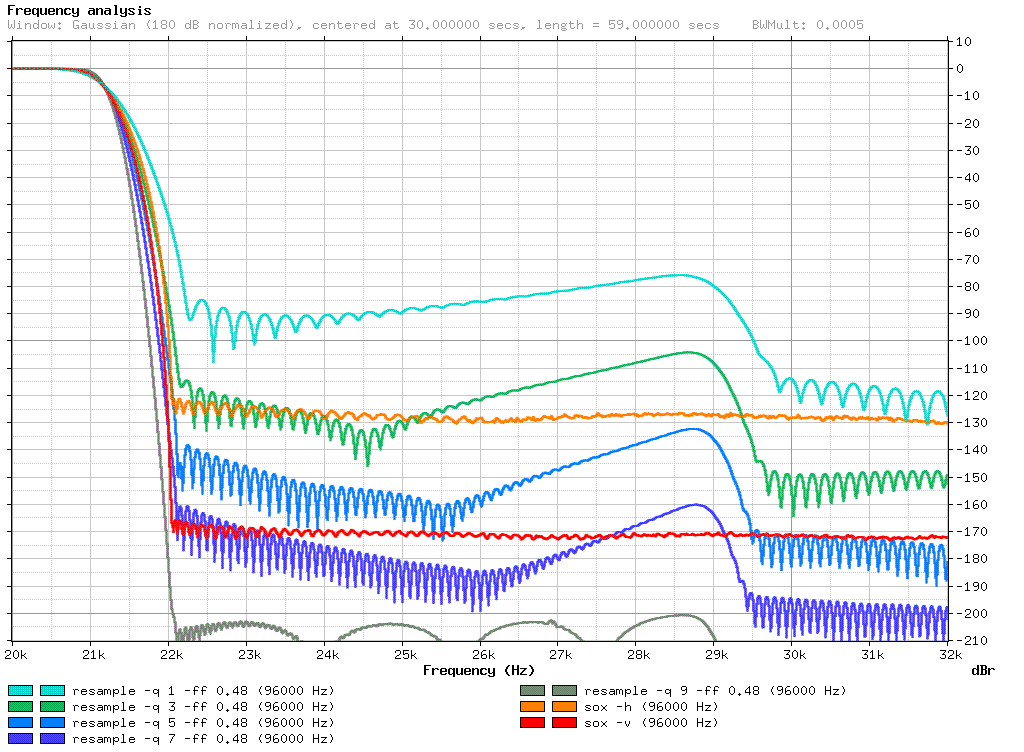
Here is what the spectrum of the 96000 Hz output files looks like:
The graph on the left uses some smoothing to reduce the clutter, but this seems to make the sox resampler look relatively worse (perhaps because it has more "noise-like" content in the stopband). The right graph was created without smoothing, but it does not show all the files.
The 96001 Hz file looks more or less the same, except "sox rate -h" is slightly noisier.
Resampling to 88200 Hz by an exact integer ratio of 2 is easier, as can be seen on the following graph:
For completeness, here is the list of parameters I used for creating the smoothed graphs:
I realize this is an old thread, but it seems like the right place to ask my question.
If using a polyphase resampler like SOX, is there anything to be gained in terms of computing power needed vs. audio quality achieved by downsampling in integer ratios rather than non integer, i.e. by going from 176400 to 88200 rather than from 176400 to 96000. It seems to me that there should be less computing power needed, but maybe that is only true in case of a very simple resampler or a resampler that falls back to a more simple algorithm in case of integer downsampling.
Could someone shed some light on this?
By the way, using different algorithms to handle different resample ratios is indeed useful for optimization purposes. In the 'resample' utility, which could admittedly still be optimized in many ways, I implemented four different cases, from fastest to slowest:
- integer power of two ratios (2, 4, 8, etc.)
- other integers (3, 5, 6, 7, ...)
- "simple" rational numbers (96000/44100 is still considered simple enough)
- any other floating point values (such as 96001/44100 in the test above)
From the benchmark results, it looks like the SoX 'rate' effect handles at least small integers and fractional values differently, but it apparently falls back to the slow method when converting from 44100 to 176400 Hz.
Thanks a lot, stv014. This is what I had always assumed to be the case, but was not able to confirm objectively. A reduction of artifacts level by 20db for integer vs. non integer ratio resampling is a very clear result.
Well, artifacts at -130 to -170 dB level are unlikely to be an audible problem, so a 20 dB difference there is not something to be worried about. For comparison, here is the same 44100->96000 Hz graph with a modified version of 'resample', where the interpolation window size (interpLen in resample.cpp at line 139) is always 48 samples, like it originally was for the -q 9 mode:
This removes most of the difference compared to the integer ratio, but the lower quality modes are now barely faster than -q 9.
I know am unlikely to hear the difference between -130db and -150db, but it simply feels better to know that the resampling is producing the cleanest possible output.
This site uses cookies to help personalise content, tailor your experience and to keep you logged in if you register.
By continuing to use this site, you are consenting to our use of cookies.