Headphone CSD waterfall plots
Mar 11, 2013 at 6:40 AM Post #886 of 937
Quote:
BTW, what do you use to obtain impulse response?

 
The utilities linked and described above
normal_smile .gif
Also, Cool Edit Pro (but anything else like Audacity would be fine) for minor editing like cropping the impulse response, smoothly fading it in and out at the ends, and scaling the amplitude so that it has approximately 0 dB gain (= -81.4 dB on the FFT plot) at 1 kHz.
 
I generate the MLS with the 'testgen' utility, and an input file like this:
Code:
 mls 0 35 10010000000000000000 0.25 0
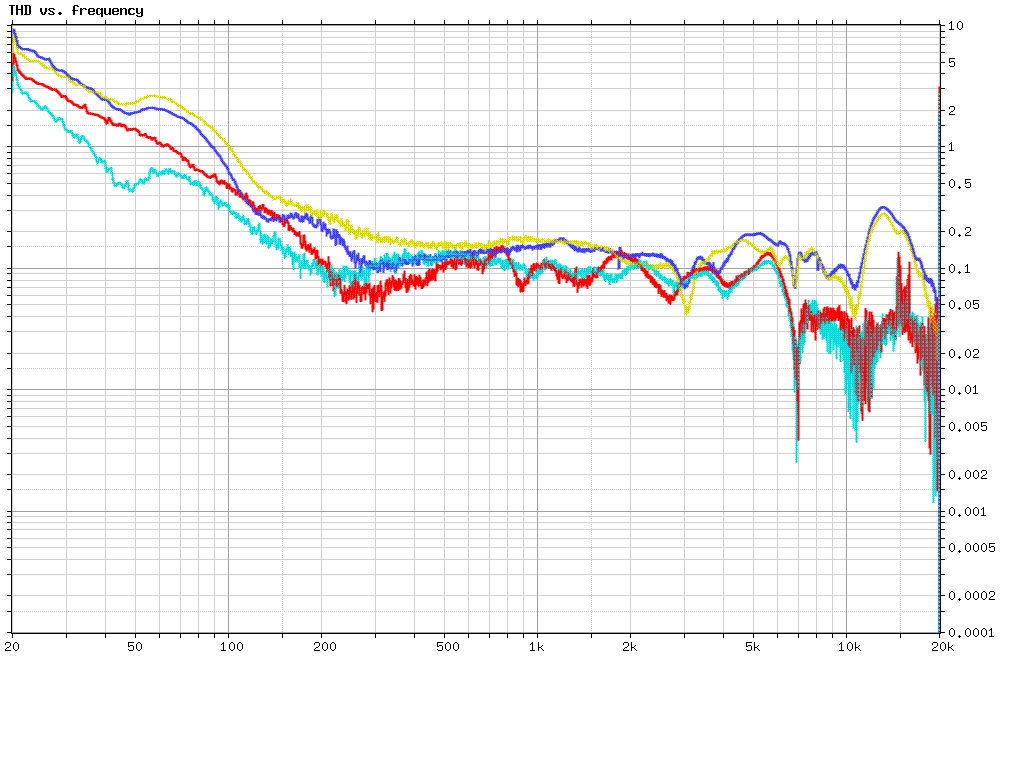
The length might be overkill, a shorter sequence could still give good enough results. The last two numbers are the amplitude on each channel, so, in this example, only the left channel is driven. The volume is set such that a 0 dBFS tone produces ~1 Vrms output level, which translates to about 100 dB SPL with the headphones tested. So, the SPL of the MLS is roughly 90 dB. It is not shown here, but I also include two long sine sweeps (for 90 and 100 dB SPL) that can be analyzed with 'thd_test' for THD vs. frequency plots and cleaner (less noisy than with MLS) frequency response.
The following command then creates the test signal in WAV format:
Code:
 testgen mls.txt mls.wav 96000 16
 
The next (and most difficult) step is to actually perform the measurement. Here, I used a Behringer ECM8000 microphone temporarily turned into an ear bud (that also has a useful side effect of blocking the loud test signals), but this method has poor and inconsistent frequency response in the treble range, and is not really suitable for any serious measurements above a couple kHz. The ECM8000 is rather noisy as well. The microphone is connected to a DIY pre-amplifier and 24V phantom power supply, and finally to the line input of the same sound card that was used for playback as well. If the DAC and ADC were not on the same device, then further measurements (using a constant frequency tone and the 'sinetest' utility) would be needed for correcting the clock frequency mismatch.
 
Once the recording is done, the impulse response(s) can be extracted from the MLS with
Code:
 convolve mls.wav ir.wav 10010000000000000000 -inv=1
The sample rate correction factor measured with 'sinetest' could be added with the -m parameter if it was necessary, but with a complex test file containing multiple signals it is better to resample and synchronize it with 'resample'. Since the ADC and DAC shared the same clock here, no correction was needed.
The impulse response file is then edited as described above to remove the unneeded parts.
 
Mar 11, 2013 at 6:48 AM Post #887 of 937
Quote:
I'd like to see the lines indicating the shape of the decay a lot more clearly visible, since right now the uniform color value seems to flatten the 3d-ness of the graph. A little bit lower of a saturation on the colors might be easier on the eyes, too.

 
Yes, the visual appearance of the graphs could still be improved, but other, more important aspects needed to be worked on first. However, if you did not view the full 1024x768 resolution images (with "open link in new tab", or whatever is equivalent to that in your browser), then the resizing blurred the lines and made them even harder to see. On the white background version (which is the default mode), the black lines are reasonably visible, but in the black background case the white lines can indeed be difficult to see on the bright and saturated colors.
 
Mar 11, 2013 at 7:49 AM Post #888 of 937
The visual aspect is fairly important, though, in the attempt to visualize data - and among the more difficult things to get right.
 
A thing to mind is color value. If all colors are the same value - same lightness or darkness - the brain'll have trouble telling them apart structurally, i.e. whether they represent the same or different depth. Right now the values in the white graph are basically the same (convert the image to greyscale and you'll see a uniform value), which makes it tough to judge depth in the graph. This is why the lines running across the graph could do with punching up (e.g. continuous lines rather than dotted) as well, so they'd indicate more clearly the shape of the decay.
 
I use the dimensions 859 x 540, which don't seem to get resized in the Head-Fi 'preview'. Not sure if 860 does.
 
Mar 11, 2013 at 11:44 AM Post #889 of 937
Another visualization option may be to change the color based on time slices rather than amplitude. This makes decay speed comparisons easier. I've been too lazy to do this with my own graphs. Very nice though! (BTW, I just noticed the displayed rise time of my own graphs are off by a factor of 10 - for those of you technically and mathematically astute.)
 
Mar 11, 2013 at 6:40 PM Post #890 of 937
A simple trick I tried is to reduce the color value depending on the distance from the peak for a more "3D" look, but I will experiment more. However, for less clutter, there are white lines only at 1 ms intervals now, rather than 0.1 ms as previously.


Mar 12, 2013 at 12:34 AM Post #891 of 937
^ Looks cool.
 
Blox M2C earbuds.


The 3 kHz peak may be a measurement artifact - I can't remember if I used an artificial ear or just ear canal for this.
 
Mar 13, 2013 at 5:49 PM Post #892 of 937
Since I make the plots by creating a 3d mesh of the decay and feeding it into a custom ray tracer, all sorts of visual tricks could be done. For instance, the above Blox decay with Fresnel reflections.


Doesn't really help readability, but cool anyway.
 
Mar 13, 2013 at 6:52 PM Post #893 of 937
Mar 15, 2013 at 4:05 PM Post #894 of 937
I use simple bitmap based drawing, with which visual tricks like that would be difficult to achieve. So, in the next version I will only fix some bugs and add the possibility of using a constant window rise time (rather than a constant fraction of the total length), which may work better with variable bandwidth. However, a 2D drawing mode could also be useful, and maybe linear frequency and/or magnitude scale as well.
 
The FFT plotting utility is now also partly written, here is what its output currently looks like when displaying two headphone distortion analysis files created by 'thd_test':

 
Mar 15, 2013 at 11:38 PM Post #895 of 937
Have you given thought to using OpenGL (very easy) to make a 3d plot? I mean, is there any specific reason to make 2d plots that nonetheless attempt to capture the third dimension as well?
 
Not saying CSD plots need fancy 3d effects, just that it's nice to experiment for increased readability.
 
Mar 16, 2013 at 1:34 AM Post #896 of 937
Very nice work stv014. Have you considered using valarrays? IME they are faster and have certain arithmetic features that make them more appealing than vectors in certain situations. It's much easier to dynamically grow vectors though.
 
As always, thank you very much for all of your efforts and contributions.
 
Mar 16, 2013 at 1:09 PM Post #897 of 937
Quote:

PS1000

We all know about these (in)famous Grados and how they sound. A few people have asked about CSDs for these and RD was kind enough to provide me with one of his own plots:

This PS1000 FR 'graph' is hysterical, I had a good laugh. 
A bit of a diversion if I may to do so. Do you know if increasing the diaphragm tension [in electrodynamic headphones] would help to straighten the frequency response line and help to eliminate 'peaks' and 'valleys' ? Better damping of soundwaves within the headphones' cup resonance chamber would be one factor in achieving this but the increased diaphragm tension might help as well. Your thoughts on it ? I have in mind Fostex TH900 and how to bring recessed mid frequencies a bit more forward. 
 
Mar 16, 2013 at 1:39 PM Post #898 of 937
There's not much tension in standard dynamic drivers - the cone usually has a surround attached. With speaker drivers, this surround is usually rubber, and sometimes foam or paper. I think the surround material of headphone drivers is usually the same material of the cone itself, but shaped differently so as to be flexible. So the issue of tension with regular ol' dynamic drivers makes not much sense. (Unless you want to tweak surround materials / construction.) As for orthos, some ortho diaphragms are tensioned (I believe the Audezes are) and some are not (Fostex T50RP)
 
Adding or subtracting damping material is a good way of tweaking orthos. Felt, foam or acoustic fiber (that holds well together), combination thereof works well. Add damping material tends to push down the bass and increase upper mids and treble. Although too much damping leads to deleterious effects, i.e. making things sound less open or compressed. Tension of the ortho diaphragm establishes the starting point and initial raw FR of where to start.
 
Damping typically does not have a huge effect with regular dynamic drivers. I have seen added damping inside the cup (where there is a bare enclosure) help with taming upper midrange or broad middle midrange peaks - or reverberation issues. I also know damping inside the cup sometimes helps with absorbing excess middle midrange energy (not too different from speakers.)
 
As for the TH900, it's more a matter of pushing down the bass and treble as opposed to raising the midrange. I figure you could put a thin layer of felt or TP like material in front of the driver to tame the highs. Taming the lows may require a larger cup. Or since the cup is not totally sealed (yup - there's a small open space between the perimeter of the frame and the wood cup which acts as a vent), you can play with the seal / invent your own. I do know that if you seal the circumfrential vent, you lose a TON of bass. Maybe sealing the vent and adding port holes you could tweak it to your liking.
 
I really have no solid answers. The best approach is to take the TH900 and start cutting it up to see what you can do with it.
 
Mar 16, 2013 at 8:39 PM Post #899 of 937
A dynamic driver is basically a tuned mass spring system at low frequency. There is no tension applied to the diaphragm, it has a self-rigidity that keeps it (or at least should keep it) rigid over the audio range.
 
In case of speaker, both the surround and the spider act as spring & damper, the cone acts as a piston over at least some of the audio range. Large excursion cones have a spring constant controlled by the spider while the surround barely acts as a damper for attenuation inevitable resonances in the cone (although I suspect most damping comes from the cone material itself - coated or multi-layer cones, ...). 
 
In case of electrodynamic headphone, there is no spider (I define the spider as the accordeon shape fiber material that keeps the voice coils at center position in the magnet gap while preventing the cone from too much displacement), and the surround fills all roles (centering the cone, letting it displace but not too much). Only thing is I suspect the damping is mainly from from the diaphragm material rather than the surround.
 
For electrostatic headphone, the membrane has no self-rigidity and must be tensioned to act as an efficient transducer. The tensioning then controls the first mechanical resonance (in the same way the spider or surround controls the Fs of the cone along with the cone mass). A bit out of topic, but I don't know if anyone has seen this: a new material with frequency dependent material characteristic (a visco-elastic polymer), in particular flexible enough to be foldable but having sufficient rigidity over the audio range to act as a transducer (provided you have some piezo-electric transducers embedded to generate vibration): http://www.technologyreview.com/view/510986/bending-your-ear-fujifilms-flexible-speakers/
 
Mar 18, 2013 at 6:22 PM Post #900 of 937
Quote:
Have you given thought to using OpenGL (very easy) to make a 3d plot?

 
It would be interesting to try later, although there are probably still more important improvements to be made than making the graphs look cool. Currently, the most likely reason why very few (if any) people other than me would use these programs is that they only have a command line interface, which most would find rather cumbersome, and is best suited for use in a script or batch file.
 
Quote:
Very nice work stv014. Have you considered using valarrays?

 
Not yet, but I could test if they would make a useful improvement somewhere.
 
For now, I have made some minor changes to csd (including the previously mentioned constant window rise time feature), and added a new fft program to the package for creating frequency response and other 2D plots (it can also create graphs from the output of groupdel and thd_test).
 

Users who are viewing this thread

Back
Top