That's a good question and one that I was concerned about too. Don't worry, I don't bite unless people invoke Nwavguy's name or don't bother reading and digesting the information in the actual posts.
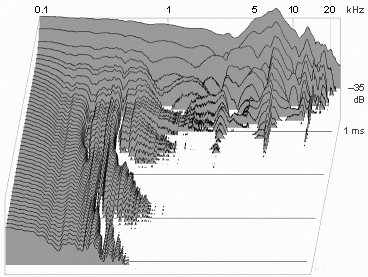
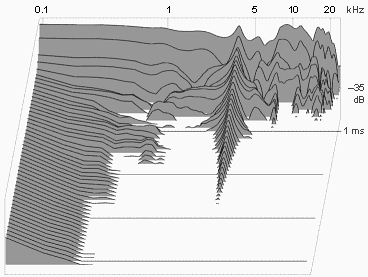
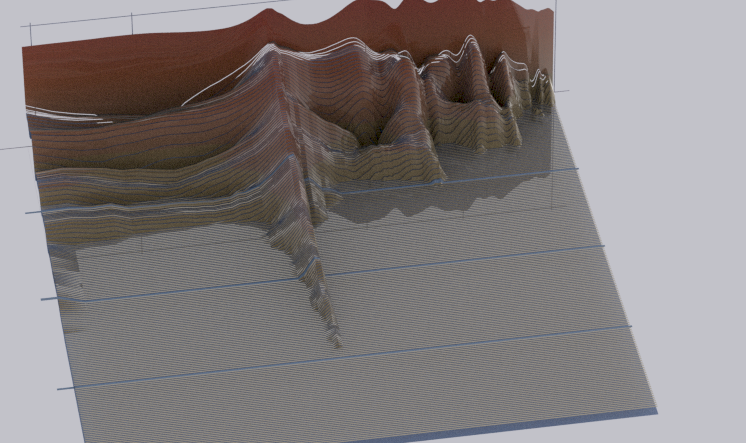
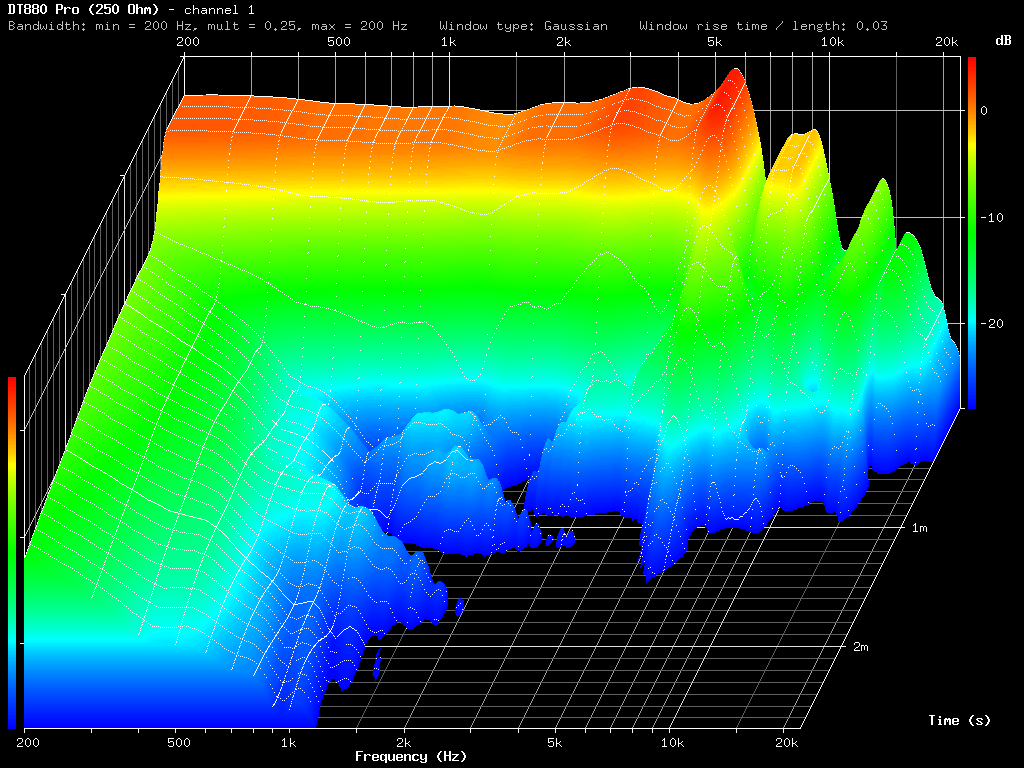
I would say it's very unlikely the ringing is a testing or processing artifact (I hope I've fixed all the bugs in the program.) If it were a testing artifact, then it would have showed up in the other plots I tested along with the LCD2 (I'll always grab something with known measurements as a control for every new measurement session where I decide to post results.) Also, it's very hard to manufacture (either intentionally or by accident) ringing artifacts in the treble!
Some people are more sensitive to ringing than others. For this pair, I definitely heard it. Anax, who is very sensitive lower treble ringing, also heard it (LOL, he was pm'ing me in the middle of the night saying something to the effect of !@#@# #*$ regarding this.) I would say that it's only occasionally piercing (not like Grados which are almost always piercing - I do use a modded SR80i on occasion.)
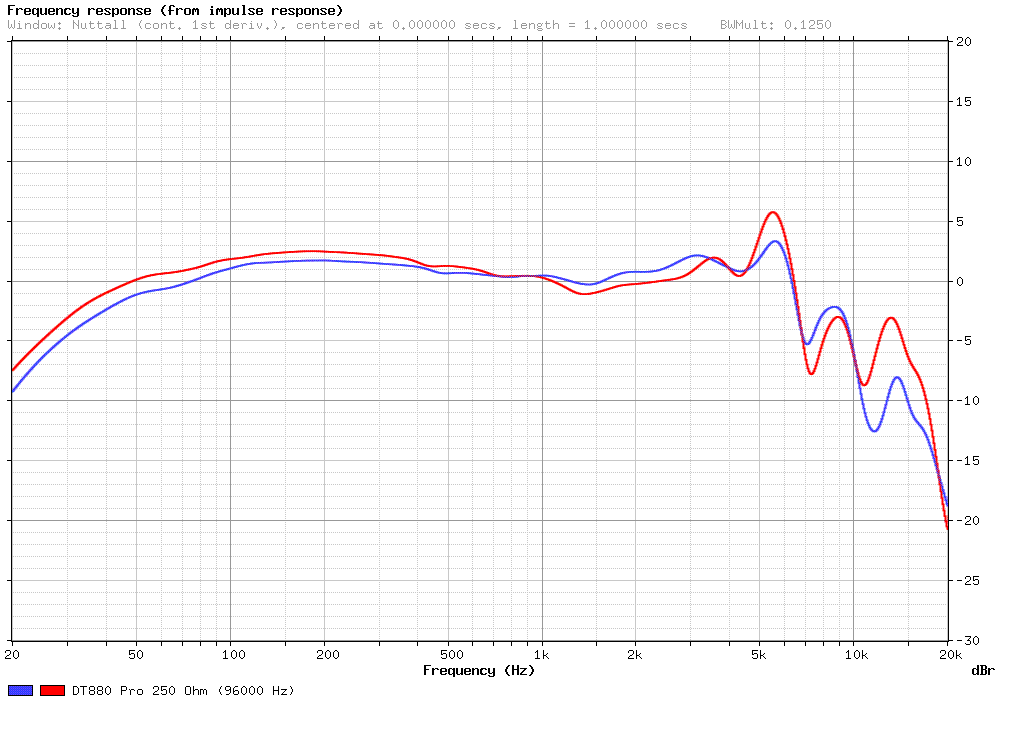
The measured ringing is not that bad - it starts at a moderate magnitude and drops down / maintains a low volume afterward (and it's also shelved down in respect to the flat bass and midrange.) What complicates things may be production variance. I've actually owned an LCD2 where this ringing was much harder to hear. If you take a look at post 152, you can even spot substantial variation in the treble between the left and right drivers with this sample.
Someone will probably bring another r1 to the meet. So it would be interesting for me to get my hands on another one.