


stv014
Headphoneus Supremus
- Joined
- Jul 17, 2011
- Posts
- 3,493
- Likes
- 273
The following article shows the results of a farily extensive test of the Xonar D1 PCI sound card. In my opinion, this card is very good value for its low (less than $100) cost, and can - if used in a machine where interference is not an issue - even compete with the ODAC. It is also available in a PCIe version (Xonar DX), which I did not test, but would hopefully perform similarly.
On the front channel output, I measured 1.934 Vrms (left) and 1.938 Vrms (right) voltage playing a 1 kHz sine wave at 0 dBFS and maximum volume. These values may vary slightly (probably within 1%) as a result of random manufacturing variation, and the DMM used also adds a potential +/- 1% inaccuracy. In any case, the card outputs slightly less than the specified 2 Vrms, but it is a relatively minor difference. The output impedance is about 100 Ω, which is not quite ideal for driving headphones, and also limits the maximum power output to less than 10 mW. The output is capacitor coupled (220 uF), and is driven by an NJM5532 op amp.
The other channels - from the CS4362 6-channel DAC chip - output a slightly higher voltage, use much smaller (22 uF) coupling capacitors, and have only a few Ω of output impedance, but driving low impedance loads from these outputs results in significantly increased distortion.
On the line input, a signal of about 2.0 Vrms is needed to reach the digital 0 dBFS level, but the distortion starts to increase at about -3 dBFS, reaching nearly 0.1 % with a full scale signal. The line input has a relatively low impedance of 3.8-3.9 kΩ.
For recording, I used a Xonar Essence STX sound card in the same PC. This made it necessary to also use a differential amplifier described and tested here, otherwise grounding issues would have significantly degraded the result. The recording sample rate and resolution were always 192 kHz and 24-bit, although in some cases I resampled the files to a different rate using a high quality converter. The tests were run on a Linux OS, using ALSA hardware (hw:x,x) devices.
The default testing conditions for the Xonar D1 (i.e. assume these parameters for all tests unless specified otherwise) were 44.1 kHz sample rate, 24-bit resolution, 5.4 kΩ load (the input of my differential amplifier without an additional low impedance load), full volume, 0 dBFS signal level, and "fast roll-off" DAC filter. All tests were performed on the front channel output of the card, not using the - generally worse quality - front panel jack.
The tests have revealed that (at least my particular) Xonar D1 has an about 6.5 ppm "slower" clock than the Xonar STX. Of course, this value is subject to random manufacturing variations, but it should be plenty low enough not to be audible (it is musically equivalent to a pitch difference of ~0.011 cents). Although pitch accuracy is usually not even a problem in onboard audio.
It is important to note that all these test results are the combination of the performance of all components used, therefore they cannot be fully reliable, even if they do show with reasonable confidence that the card is objectively fairly good (it is unlikely that both the playback and recording devices are significantly poor, and the errors almost perfectly cancel each other out). In particular, the following limitations of the recording equipment might need to be taken into account:
- there is a small amount of bass roll-off, about -0.1 dB at 20 Hz
- the ultrasonic range is also rolled off, but at 20 kHz the error should be within 0.1 dB
- the total A-weighted noise floor (ADC + differential amplifier) is approximately -115.5 dBFS
- there is some AC hum from the differential amplifier (less than -120 dBFS at 50 Hz)
- while the distortion is fairly low, it is not insignificant compared to that of the DAC on the Xonar D1; it also increases at the highest audio frequencies. However, it should generally be within 0.001%, and at a not too high frequency and/or level, probably less
- from about 50 kHz upwards, there is a significant "hump" in the noise floor, caused by noise shaping in the ADC
- crosstalk is not low enough to allow for accurate measurement of this aspect of a high quality DAC, although it still well below any reasonable threshold of audibility
- with the 22 Ω load, the (normalized) noise floor is much higher, because, due to the high output impedance, the input level to the ADC is lower by a ratio of 22 / (100 + 22), and the recording dynamic range is decreased accordingly
Also keep in mind that the (especially noise) performance of a sound card can vary depending on the machine it is installed in. My PC is probably not a particularly noisy one, and the Xonar D1 is also in a PCI slot that is the farthest away from possible sources of interference.


Green: 44.1 kHz sample rate
Red: 44.1 kHz, 22 Ω load
Yellow: 96 kHz
Blue: 44.1 kHz, slow roll-off DAC filter
Note that there is a slight bass roll-off (about -0.1 dB at 20 Hz) from the A/D converter of the Xonar STX. The line input of the Xonar D1 has a similar roll-off, by the way. On the output, there is only a relatively significant bass roll-off (still only about 0.5 dB) when driving a low impedance load; this is caused by the 220 uF output capacitors.
The graph on the right has a linear frequency scale, to better show the details of the high frequency response.
Overall, the response is very flat, and should not be much of an issue in practice when using the card as a line level source.

Blue: 22 Ω load, left to right
Yellow: 22 Ω load, right to left
Green: 5.4 kΩ load, left to right
Red: 5.4 kΩ load, right to left
Note: much of the crosstalk measured with a high impedance load at high frequency results from the recording gear, cables, and connectors. This is not easy to avoid, since with an output impedance of 100 Ω, it takes less than 10 pF capacitance between the channels to produce a graph like what is shown above. For the low impedance load, most of the crosstalk is caused by the ground impedance. In any case, none of this is close to actually being audible.
Left: both channels driven, right: only one channel driven (the lower traces are cross-channel distortion, but in practice contain mostly noise)


Green / left: 44.1 kHz
Red / left: 44.1 kHz, 22 Ω load
Yellow / left: 96 kHz
Blue / left: 44.1 kHz, -10 dBFS level (all the others are at 0 dBFS); this is in fact dominated by noise
Green / right: 44.1 kHz, left channel driven
Red / right: 44.1 kHz, right channel driven
Blue / right: 44.1 kHz, 22 Ω load, left channel driven
Yellow / right: 44.1 kHz, 22 Ω load, right channel driven
Bandwidth: 50000 Hz
Maximum order THD tested: 5
As noted above, the cross-channel distortion graphs are mostly just noise, but with a low impedance load at high frequency, there is actually some distortion into the other channel. The analysis is more sensitive to noise at higher frequencies, because the window size used decreases with frequency. Also, with the 22 Ω load, the overall noise floor on the graphs is increased (this results from the dynamic range of the ADC not being fully used, rather than the output actually becoming more noisy).
On all the graphs below, 1 on the horizontal scale means 0 dBFS level.
Left: 44.1 kHz, 5.4 kΩ load; right: 44.1 kHz, 22 Ω load


Red: 60 Hz
Yellow/Orange: 1000 Hz
Green: 15000 Hz
See also the comments above at THD vs. frequency.
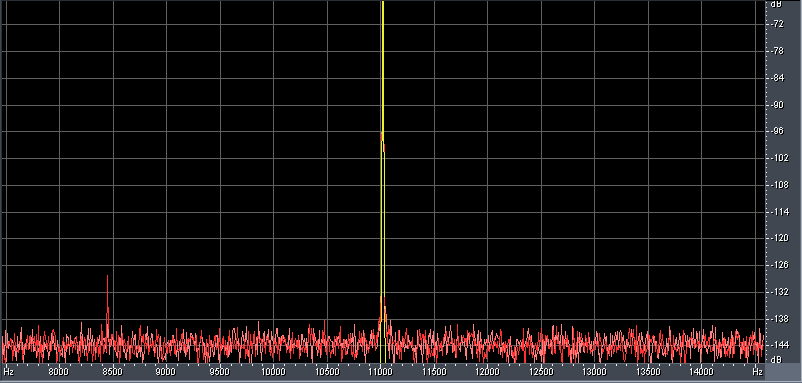
44.1 kHz, 22 Ω load, 11025 Hz signal

This test used a trick (sample rate / 4 tone at 45 degrees phase) to create an output level of greater than 0 dBFS. Unlike many other DACs, the CS4398 apparently has headroom for such signals, and the card only starts to clip at about +2 dBFS (the Xonar STX would have hard clipping at exactly 0 dBFS).
The vertical axis is the deviation from the correct level (it does show channel imbalance), so ideally you should see perfectly flat horizontal lines. At very low levels, the measurement is increasingly dominated by noise.


Left:
Blue/Red: left/right channel low level linearity
Cyan/Yellow: left/right channel high level linearity (included as a level reference)
Right:
Blue/Red: left/right channel high level linearity with zoomed in vertical scale
The following graph shows performance with a low level signal under more difficult conditions. In addition to a 1201 Hz tone at -90 dBFS, the card has to play a large 431 Hz signal so that the overall peak amplitude is basically exactly 0 dBFS:

Yellow: noise floor at 44.1 kHz
Blue: test signals at 44.1 kHz
Red: noise floor at 44.1 kHz, 22 Ω load
Green: test signals at 44.1 kHz, 22 Ω load
The graph is somewhat confusing because of all the noise, interference, and THD products of the high level signal, but there are no apparent THD or IMD products of the low level 1201 Hz tone, and it is at the correct -90 dBFS level, so the results are good.
20 Hz (left) and 1 kHz (right) at 0 dBFS, red: 22 Ω load, yellow: 5.4 kΩ load. Note: the "humps" at integer multiples of 50 Hz are AC hum in the recording. The reason why they are not just narrow peaks is that the graph was created from the same sine sweep that was used in the THD vs. frequency analysis, with high quality dynamic resampling so that the frequency of the test tone itself remains constant.


20 kHz; red: 96 kHz sample rate, green: 44.1 kHz sample rate, yellow: 44.1 kHz sample rate with 22 Ω load

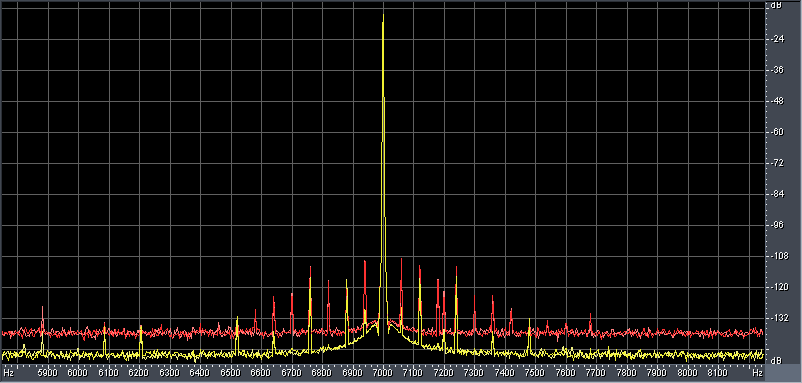
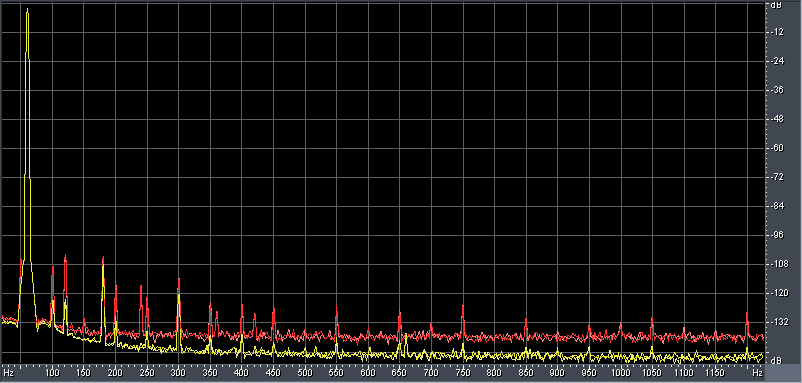
60 Hz + 7000 Hz 4:1, 44.1 kHz sample rate (note the AC hum and its harmonics at multiples of 50 Hz, this comes from the recording gear, not the Xonar D1)


19000 Hz + 20000 Hz 1:1, 44.1 kHz sample rate

Yellow: 5.4 kΩ load
Red: 22 Ω load
Left: 16-bit samples, right: 24-bit samples; both at 44.1 kHz sample rate


24-bit samples with system load (increased CPU+HDD+GPU activity)

Yellow: the spectrum of the Jtest signal itself (i.e. zero jitter)
Red: what was actually recorded, not driving a low impedance load
The graphs were created using a 65536 sample Blackman-Harris window, and the 192 kHz recorded audio was resampled to 44.1 kHz, also correcting the slight sample rate mismatch between the DAC and ADC; this eliminated spurious "spread" from the windowing. The amplitude of the 11.025 kHz tone is -3 dBFS.
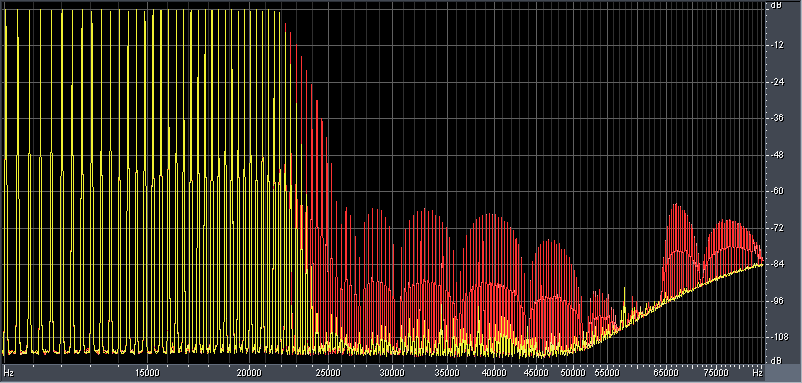
Spectrum of a 7-bit maximum length sequence at 44.1 kHz sample rate with the fast (yellow) and slow (red) roll-off DAC filters (fundamental frequency = 347.244 Hz):

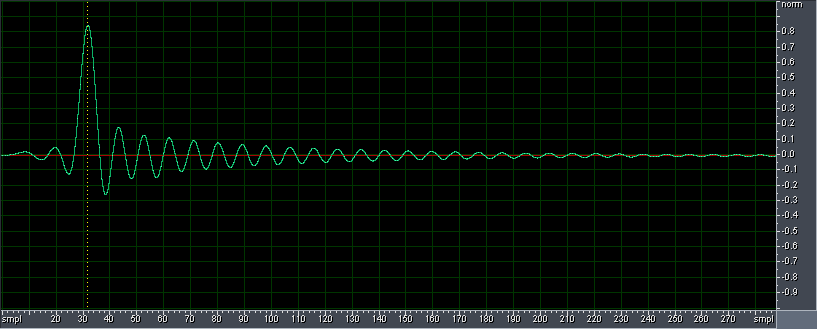
Impulse response, left: fast roll-off, right: slow roll-off (1.5 ms duration)


Phase response, and group delay vs. frequency, green: fast roll-off, yellow/orange: slow roll-off


It is too small to be visible on this graph, but there is also a slight delay between the channels, about 0.17 degrees of phase difference at 11025 Hz, or 43 ns delay. Neither the group-, nor the interchannel delay is high enough to be audible, though, I have seen the thresholds to be estimated at ~1 ms (it depends on the frequency, and is shortest in the midrange) and ~10 us, respectively.
System activity: if "yes", then there was intentionally high CPU, HDD, and GPU activity during the test. Oddly, this slightly reduced the noise level, but the test was performed at a different time, and factors like different temperature might have affected the results. In any case, the effect is minor, and listening to the recorded noise at greatly increased amplitude (by 80 dB) also reveals only a small amount of interference. On the other hand, the THD slightly increased, which again may have been the result of the system load, or other random factors. Of course, interference effects could be much more significant on other machines, especially ones with high end gaming GPUs or other high power components.
Signal level: the level of the 1 kHz test tone in dBFS
L RMS: unweighted total signal level measured relative to 2.0 Vrms, with a bandwidth of 5 Hz to 22 kHz
L A-wtd: same as L RMS, but with the standard A-weighting filter applied
R RMS, R A-wtd: same as above, but for the right channel
L/R THD+N RMS/A-wtd: similar to above, but with a narrow notch filter applied at 1 kHz, to remove the test tone; to calculate actual THD+N values, subtract the 0 dBFS signal levels from the 0 dBFS THD+N levels
L/R Noise RMS/A-wtd: similar to above, but with further narrow notch filters applied at harmonics of the 1 kHz tone, up to 11th order
Dynamic range: this is calculated from the A-weighted THD+N at -60 dBFS, and the A-weighted total signal level at 0 dBFS; the signal power (10 ^ (dB_level / 10)) is summed on the two channels to get the overall levels
Compensated: the approximately -115.5 dBFS A-weighted noise floor of the recording gear is subtracted from the THD+N levels used in the dynamic range calculations, in order to extrapolate the dynamic range of the DAC itself, and factor out noise from the ADC and differential amplifier; of course, these are not perfectly accurate, but should be an improvement over the raw dynamic range values
What the results show, is that the card is apparently capable of the specified dynamic range (116 dB) and THD+N (-105 dB) at a sample rate that is a multiple of 48 kHz, but the noise performance degrades significantly at 44.1/88.2/176.4 kHz. This problem is common to Xonar family sound cards. However, the nearly 110 dB A-weighted dynamic range at 44.1 kHz is still very decent, and only slightly worse than that of the more expensive ODAC and Xonar STX (at the same sample rate).
The CS4398 does not distort as much more at 96 kHz compared to 48 kHz as the PCM1792 used on the Xonar STX.
Noise modulation is very low, increasing the signal level from -60 dBFS to 0 dBFS increased the noise floor by less than 1 dB. The Realtek ALC887 onboard audio I tested is much worse in this aspect, and some popular budget external DACs also have relatively high noise modulation.
The line input of the Xonar D1 is not shown in the table above, but it can, in the best case, reproduce the -112 dBFS A-weighted noise floor claimed by the manufacturer.
Stereophile Xonar Essence ST/STX measurements
Xonar STX test report by ASUS (for comparison)
OK, so what CAN I reliably measure from a PC soundcard ? (Sound Science forum thread)
CS4398 datasheet
Op amp distortion measurements
Basic parameters (input/output levels and impedances)
On the front channel output, I measured 1.934 Vrms (left) and 1.938 Vrms (right) voltage playing a 1 kHz sine wave at 0 dBFS and maximum volume. These values may vary slightly (probably within 1%) as a result of random manufacturing variation, and the DMM used also adds a potential +/- 1% inaccuracy. In any case, the card outputs slightly less than the specified 2 Vrms, but it is a relatively minor difference. The output impedance is about 100 Ω, which is not quite ideal for driving headphones, and also limits the maximum power output to less than 10 mW. The output is capacitor coupled (220 uF), and is driven by an NJM5532 op amp.
The other channels - from the CS4362 6-channel DAC chip - output a slightly higher voltage, use much smaller (22 uF) coupling capacitors, and have only a few Ω of output impedance, but driving low impedance loads from these outputs results in significantly increased distortion.
On the line input, a signal of about 2.0 Vrms is needed to reach the digital 0 dBFS level, but the distortion starts to increase at about -3 dBFS, reaching nearly 0.1 % with a full scale signal. The line input has a relatively low impedance of 3.8-3.9 kΩ.
Test setup
For recording, I used a Xonar Essence STX sound card in the same PC. This made it necessary to also use a differential amplifier described and tested here, otherwise grounding issues would have significantly degraded the result. The recording sample rate and resolution were always 192 kHz and 24-bit, although in some cases I resampled the files to a different rate using a high quality converter. The tests were run on a Linux OS, using ALSA hardware (hw:x,x) devices.
The default testing conditions for the Xonar D1 (i.e. assume these parameters for all tests unless specified otherwise) were 44.1 kHz sample rate, 24-bit resolution, 5.4 kΩ load (the input of my differential amplifier without an additional low impedance load), full volume, 0 dBFS signal level, and "fast roll-off" DAC filter. All tests were performed on the front channel output of the card, not using the - generally worse quality - front panel jack.
The tests have revealed that (at least my particular) Xonar D1 has an about 6.5 ppm "slower" clock than the Xonar STX. Of course, this value is subject to random manufacturing variations, but it should be plenty low enough not to be audible (it is musically equivalent to a pitch difference of ~0.011 cents). Although pitch accuracy is usually not even a problem in onboard audio.
It is important to note that all these test results are the combination of the performance of all components used, therefore they cannot be fully reliable, even if they do show with reasonable confidence that the card is objectively fairly good (it is unlikely that both the playback and recording devices are significantly poor, and the errors almost perfectly cancel each other out). In particular, the following limitations of the recording equipment might need to be taken into account:
- there is a small amount of bass roll-off, about -0.1 dB at 20 Hz
- the ultrasonic range is also rolled off, but at 20 kHz the error should be within 0.1 dB
- the total A-weighted noise floor (ADC + differential amplifier) is approximately -115.5 dBFS
- there is some AC hum from the differential amplifier (less than -120 dBFS at 50 Hz)
- while the distortion is fairly low, it is not insignificant compared to that of the DAC on the Xonar D1; it also increases at the highest audio frequencies. However, it should generally be within 0.001%, and at a not too high frequency and/or level, probably less
- from about 50 kHz upwards, there is a significant "hump" in the noise floor, caused by noise shaping in the ADC
- crosstalk is not low enough to allow for accurate measurement of this aspect of a high quality DAC, although it still well below any reasonable threshold of audibility
- with the 22 Ω load, the (normalized) noise floor is much higher, because, due to the high output impedance, the input level to the ADC is lower by a ratio of 22 / (100 + 22), and the recording dynamic range is decreased accordingly
Also keep in mind that the (especially noise) performance of a sound card can vary depending on the machine it is installed in. My PC is probably not a particularly noisy one, and the Xonar D1 is also in a PCI slot that is the farthest away from possible sources of interference.
Frequency response
Green: 44.1 kHz sample rate
Red: 44.1 kHz, 22 Ω load
Yellow: 96 kHz
Blue: 44.1 kHz, slow roll-off DAC filter
Note that there is a slight bass roll-off (about -0.1 dB at 20 Hz) from the A/D converter of the Xonar STX. The line input of the Xonar D1 has a similar roll-off, by the way. On the output, there is only a relatively significant bass roll-off (still only about 0.5 dB) when driving a low impedance load; this is caused by the 220 uF output capacitors.
The graph on the right has a linear frequency scale, to better show the details of the high frequency response.
Overall, the response is very flat, and should not be much of an issue in practice when using the card as a line level source.
Crosstalk
Blue: 22 Ω load, left to right
Yellow: 22 Ω load, right to left
Green: 5.4 kΩ load, left to right
Red: 5.4 kΩ load, right to left
Note: much of the crosstalk measured with a high impedance load at high frequency results from the recording gear, cables, and connectors. This is not easy to avoid, since with an output impedance of 100 Ω, it takes less than 10 pF capacitance between the channels to produce a graph like what is shown above. For the low impedance load, most of the crosstalk is caused by the ground impedance. In any case, none of this is close to actually being audible.
THD vs. frequency
Left: both channels driven, right: only one channel driven (the lower traces are cross-channel distortion, but in practice contain mostly noise)
Green / left: 44.1 kHz
Red / left: 44.1 kHz, 22 Ω load
Yellow / left: 96 kHz
Blue / left: 44.1 kHz, -10 dBFS level (all the others are at 0 dBFS); this is in fact dominated by noise
Green / right: 44.1 kHz, left channel driven
Red / right: 44.1 kHz, right channel driven
Blue / right: 44.1 kHz, 22 Ω load, left channel driven
Yellow / right: 44.1 kHz, 22 Ω load, right channel driven
Bandwidth: 50000 Hz
Maximum order THD tested: 5
As noted above, the cross-channel distortion graphs are mostly just noise, but with a low impedance load at high frequency, there is actually some distortion into the other channel. The analysis is more sensitive to noise at higher frequencies, because the window size used decreases with frequency. Also, with the 22 Ω load, the overall noise floor on the graphs is increased (this results from the dynamic range of the ADC not being fully used, rather than the output actually becoming more noisy).
THD vs. level
On all the graphs below, 1 on the horizontal scale means 0 dBFS level.
Left: 44.1 kHz, 5.4 kΩ load; right: 44.1 kHz, 22 Ω load
Red: 60 Hz
Yellow/Orange: 1000 Hz
Green: 15000 Hz
See also the comments above at THD vs. frequency.
44.1 kHz, 22 Ω load, 11025 Hz signal
This test used a trick (sample rate / 4 tone at 45 degrees phase) to create an output level of greater than 0 dBFS. Unlike many other DACs, the CS4398 apparently has headroom for such signals, and the card only starts to clip at about +2 dBFS (the Xonar STX would have hard clipping at exactly 0 dBFS).
Linearity
The vertical axis is the deviation from the correct level (it does show channel imbalance), so ideally you should see perfectly flat horizontal lines. At very low levels, the measurement is increasingly dominated by noise.
Left:
Blue/Red: left/right channel low level linearity
Cyan/Yellow: left/right channel high level linearity (included as a level reference)
Right:
Blue/Red: left/right channel high level linearity with zoomed in vertical scale
The following graph shows performance with a low level signal under more difficult conditions. In addition to a 1201 Hz tone at -90 dBFS, the card has to play a large 431 Hz signal so that the overall peak amplitude is basically exactly 0 dBFS:
Yellow: noise floor at 44.1 kHz
Blue: test signals at 44.1 kHz
Red: noise floor at 44.1 kHz, 22 Ω load
Green: test signals at 44.1 kHz, 22 Ω load
The graph is somewhat confusing because of all the noise, interference, and THD products of the high level signal, but there are no apparent THD or IMD products of the low level 1201 Hz tone, and it is at the correct -90 dBFS level, so the results are good.
THD spectrum
20 Hz (left) and 1 kHz (right) at 0 dBFS, red: 22 Ω load, yellow: 5.4 kΩ load. Note: the "humps" at integer multiples of 50 Hz are AC hum in the recording. The reason why they are not just narrow peaks is that the graph was created from the same sine sweep that was used in the THD vs. frequency analysis, with high quality dynamic resampling so that the frequency of the test tone itself remains constant.
20 kHz; red: 96 kHz sample rate, green: 44.1 kHz sample rate, yellow: 44.1 kHz sample rate with 22 Ω load
Intermodulation distortion
60 Hz + 7000 Hz 4:1, 44.1 kHz sample rate (note the AC hum and its harmonics at multiples of 50 Hz, this comes from the recording gear, not the Xonar D1)
19000 Hz + 20000 Hz 1:1, 44.1 kHz sample rate
Yellow: 5.4 kΩ load
Red: 22 Ω load
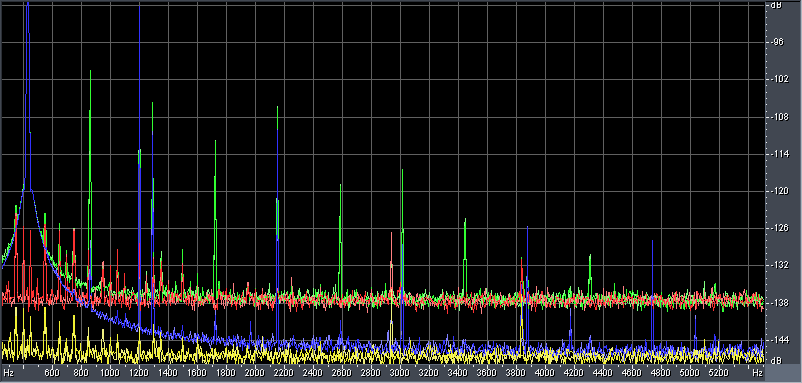
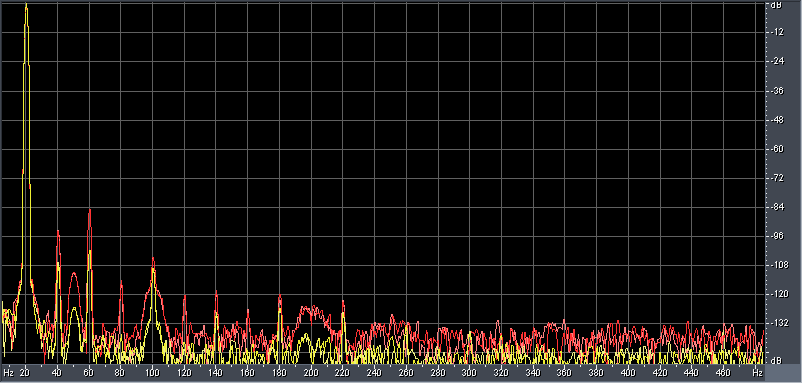
Jitter
Left: 16-bit samples, right: 24-bit samples; both at 44.1 kHz sample rate
24-bit samples with system load (increased CPU+HDD+GPU activity)
Yellow: the spectrum of the Jtest signal itself (i.e. zero jitter)
Red: what was actually recorded, not driving a low impedance load
The graphs were created using a 65536 sample Blackman-Harris window, and the 192 kHz recorded audio was resampled to 44.1 kHz, also correcting the slight sample rate mismatch between the DAC and ADC; this eliminated spurious "spread" from the windowing. The amplitude of the 11.025 kHz tone is -3 dBFS.
DAC filter
Spectrum of a 7-bit maximum length sequence at 44.1 kHz sample rate with the fast (yellow) and slow (red) roll-off DAC filters (fundamental frequency = 347.244 Hz):
Impulse response, left: fast roll-off, right: slow roll-off (1.5 ms duration)
Phase response, and group delay vs. frequency, green: fast roll-off, yellow/orange: slow roll-off
It is too small to be visible on this graph, but there is also a slight delay between the channels, about 0.17 degrees of phase difference at 11025 Hz, or 43 ns delay. Neither the group-, nor the interchannel delay is high enough to be audible, though, I have seen the thresholds to be estimated at ~1 ms (it depends on the frequency, and is shortest in the midrange) and ~10 us, respectively.
Noise, dynamic range, and THD+N at 1 kHz
| Sample rate | Load | System activity | Signal level | L RMS | L A-wtd | R RMS | R A-wtd | L THD+N RMS | L THD+N A-wtd | R THD+N RMS | R THD+N A-wtd | L Noise RMS | L Noise A-wtd | R Noise RMS | R Noise A-wtd | Dynamic range | Compensated |
| 44.1k | 5.4k | No | -60 | -60.74 | -60.74 | -60.71 | -60.71 | -106.52 | -109.36 | -106.38 | -109.30 | -106.54 | -109.38 | -106.39 | -109.33 | 108.60 | 109.81 |
| 0 | -0.74 | -0.74 | -0.71 | -0.71 | -103.88 | -104.89 | -103.92 | -105.05 | -105.98 | -108.66 | -105.85 | -108.58 | |||||
| 44.1k | 5.4k | Yes | -60 | -60.74 | -60.74 | -60.71 | -60.71 | -106.54 | -109.56 | -106.45 | -109.54 | -106.55 | -109.59 | -106.46 | -109.57 | 108.83 | 110.10 |
| 0 | -0.74 | -0.74 | -0.71 | -0.71 | -103.69 | -104.62 | -103.76 | -104.81 | -105.99 | -108.81 | -105.89 | -108.77 | |||||
| 44.1k | 22 | No | -60 | -75.55 | -75.55 | -75.55 | -75.55 | -111.74 | -115.04 | -111.75 | -115.10 | -111.75 | -115.06 | -111.76 | -115.12 | 99.51 | 109.77 |
| 0 | -15.56 | -15.56 | -15.56 | -15.56 | -109.81 | -111.06 | -109.68 | -110.87 | -111.68 | -114.97 | -111.67 | -115.01 | |||||
| 48k | 5.4k | No | -60 | -60.74 | -60.74 | -60.71 | -60.71 | -110.07 | -113.50 | -109.87 | -113.53 | -110.08 | -113.52 | -109.89 | -113.59 | 112.79 | 117.14 |
| 0 | -0.74 | -0.74 | -0.71 | -0.71 | -106.02 | -106.65 | -106.05 | -106.85 | -109.50 | -112.51 | -109.27 | -112.47 | |||||
| 96k | 5.4k | No | -60 | -60.75 | -60.75 | -60.72 | -60.72 | -110.02 | -113.50 | -109.90 | -113.51 | -110.04 | -113.53 | -109.93 | -113.58 | 112.78 | 117.11 |
| 0 | -0.74 | -0.74 | -0.72 | -0.72 | -105.79 | -106.26 | -105.94 | -106.56 | -109.56 | -112.63 | -109.44 | -112.65 |
System activity: if "yes", then there was intentionally high CPU, HDD, and GPU activity during the test. Oddly, this slightly reduced the noise level, but the test was performed at a different time, and factors like different temperature might have affected the results. In any case, the effect is minor, and listening to the recorded noise at greatly increased amplitude (by 80 dB) also reveals only a small amount of interference. On the other hand, the THD slightly increased, which again may have been the result of the system load, or other random factors. Of course, interference effects could be much more significant on other machines, especially ones with high end gaming GPUs or other high power components.
Signal level: the level of the 1 kHz test tone in dBFS
L RMS: unweighted total signal level measured relative to 2.0 Vrms, with a bandwidth of 5 Hz to 22 kHz
L A-wtd: same as L RMS, but with the standard A-weighting filter applied
R RMS, R A-wtd: same as above, but for the right channel
L/R THD+N RMS/A-wtd: similar to above, but with a narrow notch filter applied at 1 kHz, to remove the test tone; to calculate actual THD+N values, subtract the 0 dBFS signal levels from the 0 dBFS THD+N levels
L/R Noise RMS/A-wtd: similar to above, but with further narrow notch filters applied at harmonics of the 1 kHz tone, up to 11th order
Dynamic range: this is calculated from the A-weighted THD+N at -60 dBFS, and the A-weighted total signal level at 0 dBFS; the signal power (10 ^ (dB_level / 10)) is summed on the two channels to get the overall levels
Compensated: the approximately -115.5 dBFS A-weighted noise floor of the recording gear is subtracted from the THD+N levels used in the dynamic range calculations, in order to extrapolate the dynamic range of the DAC itself, and factor out noise from the ADC and differential amplifier; of course, these are not perfectly accurate, but should be an improvement over the raw dynamic range values
What the results show, is that the card is apparently capable of the specified dynamic range (116 dB) and THD+N (-105 dB) at a sample rate that is a multiple of 48 kHz, but the noise performance degrades significantly at 44.1/88.2/176.4 kHz. This problem is common to Xonar family sound cards. However, the nearly 110 dB A-weighted dynamic range at 44.1 kHz is still very decent, and only slightly worse than that of the more expensive ODAC and Xonar STX (at the same sample rate).
The CS4398 does not distort as much more at 96 kHz compared to 48 kHz as the PCM1792 used on the Xonar STX.
Noise modulation is very low, increasing the signal level from -60 dBFS to 0 dBFS increased the noise floor by less than 1 dB. The Realtek ALC887 onboard audio I tested is much worse in this aspect, and some popular budget external DACs also have relatively high noise modulation.
The line input of the Xonar D1 is not shown in the table above, but it can, in the best case, reproduce the -112 dBFS A-weighted noise floor claimed by the manufacturer.
Useful links
Stereophile Xonar Essence ST/STX measurements
Xonar STX test report by ASUS (for comparison)
OK, so what CAN I reliably measure from a PC soundcard ? (Sound Science forum thread)
CS4398 datasheet
Op amp distortion measurements
")
