hans030390
1000+ Head-Fier
- Joined
- Dec 4, 2008
- Posts
- 1,372
- Likes
- 609
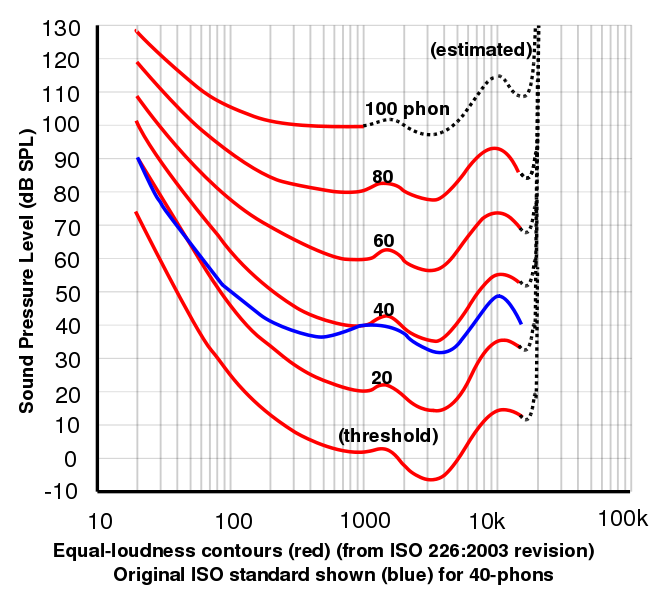
When people measure the frequency response of something and put it in a graph, do they usually account for the fact that the human ear doesn't hear every frequency at the same loudness? I was just looking at the equal-loudness contour graphs, so that's why I'm asking.
I'm sure this has been asked before, and I'm sure there's a simple answer to it.
I'm sure this has been asked before, and I'm sure there's a simple answer to it.