Quote:
Originally Posted by nick_charles /img/forum/go_quote.gif
First off thanks for all your hard work and planning, I hope your teachers recognize it adequately.
A few things you might like to add to your next post. What were the scales used and what was the magnitude of the differences. Did you measure average differences, peak and minimum, what was the duration of the test signals and what period of time is captured in the photos.
Can you annotate your photos a bit more, it is hard to tell which test pairs they refer to. Which one was the ALO ALO baseline white noise test ?, if it is 9/31 then these waves look a bit divergent apart from the spot you zoomed in on.
In 23 and 24 the waveforms are almost flat , yet in almost all the other ones the waveforms are much more sinuous, this is odd, did you keep the zoom constant when comparing the cables.
Also white noise is non deterministic (random but not perfectly random) which means that you cannot directly compare any two tests as the waves are not identical, so differences will be accentuated in some circumstances and attenuated in others depending on the exact sample, was the white noise bandwidth limited to the audible spectrum ?
Also was the signal generator creating two different sets of white noise at its outputs or was it the same signal sent to 2 outputs, this is important, if it is two independently generated signals then given the random nature of white noise you may not always be comparing identical signals.
Did you try swapping cables by input i.e (X in A and Y into B) then (Y into A and X into B) ?
Were you able to see the waveform before it was transmitted, this would give you a picture of how accurate the transmission was.
Overall you have shown technical differences between cables, I would like to know more about the magnitude.
I am not quite sure how meaningful your RFI test is, would it not have been better to have a complete circuit but a null signal ?
thanks again.
|
Great Questions Nick,
Firstly this has almost nothing to do with my teachers, I kinda just freelanced this project for my own edification but I appreciate the kind words =D.
Unfortunately I was unable to get a machine that was able to calculate the magnitude of the differences adequately because they were changing so quickly. I think it is very pertinent that I explain a bit more about the exact setup. I used a bnc to rca adapter into a rca to 2 rca splitter from the waveform generator and then used that to send two of the exact same signals from the generator to the oscilloscope which I used two channels. I went ahead and did the tests with two of the same cables to make sure differences were not coming from the splitter between the channels.
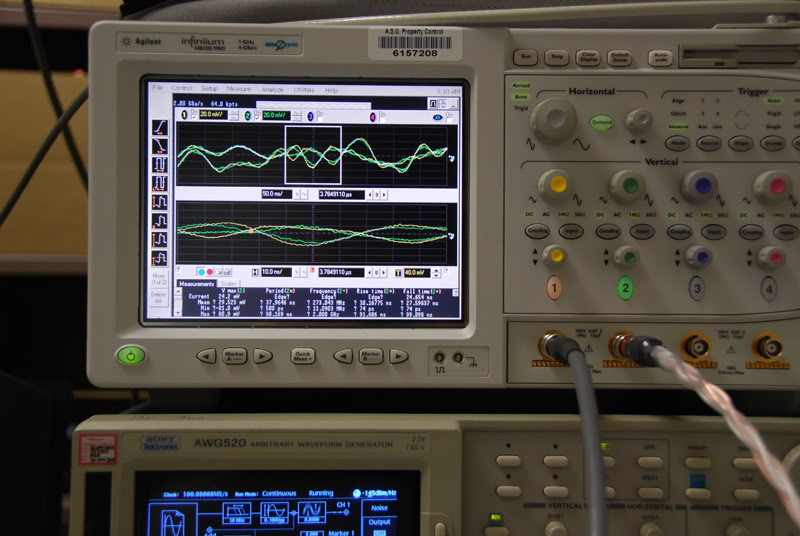
I took the pictures to provide some photographic evidence, but it was hard to capture what was happening. If you were present and watching it the differences were not subtle, take a look at this picture-
It is the unknown make white cable against the ALO A (SXC). The white is the yellow lines, the alo is the green lines. You can see in this picture that there are distinct yellow and green lines. When the waveform is on top of another, or equal at a point, the waves combine to turn white, such as in this picture -
which is the ALO A against the ALO A baseline. You cant see any distinct yellow or green which means the waves are equal.
So basically I superimposed the waves from the cable and saw the differences. Unfortunately because white noise is fairly random, I was unable to calculate magnitude of differences nor apply them across the board. In the upper boxes in those two tests it shows a 50ns clip of the wave and in the bottom a 10ns clip of the wave. These times were constant in all of the tests.
As you stated above white noise can be fairly random, which is why I was only able to compare one cable against another at the specific moment in time. The main point of this lab was to show whether or not there was a difference between cables and I felt that showing two cables passing electrical waveforms differently between themselves at that moment in time acted as a proof for that statement. Unfortunately some of the cables had far more radical waves and others more simplistic waves, but it still applies because music has different waveforms.
I did actually switch around the cables quite a bit inside of the splitter and in the channels in the oscilloscope before hand and noted no differences so I didn't photograph this part.
The machinery I was using was not able to be programmed with the original wave so I could not do a direct comparison to show accuracy. I wish it would have.
The RFI test was a bit of a side project. Having one end out made it much easier to photograph the differences because it showed a larger magnitude. I did test quite a few as a circuit and all of those that tested high unplugged showed quite a bit of RFI even as a circuit. The midrange RFI subjects showed very little RFI but still present and those that showed very little unplugged were indistinguishable in the test. I hate to put such terms in line with science but I can not use numbers because I have none. All I can show is the pictures that showed that in fact there were differences.
Thank you for the great questions, I will be updating this thread in due time but its coming to the end of the semester which means my schedule is getting hectic.
Regards,
Dave