Headphone CSD waterfall plots
Aug 13, 2011 at 1:31 AM Thread Starter Post #1 of 937

purrin

aka Marvey, purr1n
Member of the Trade: Eddie Current
Joined
Aug 2, 2008
Posts
5,408
Likes
1,327

MASTER INDEX OF CSD / WATERFALL PLOTS

THIS IS OUT OF DATE - I AM NO LONGER MAINTAINING THE INDEX (THE INDEX IS INCOMPLETE.) YOU WILL HAVE TO SEARCH THE THREAD OR GOOGLE. I WILL OCCASIONALLY POST SOMETHING IF THERE ARE REQUESTS OR PEOPLE SEND STUFF TO ME.
 
Audio Technica AD2000
Dr Dre Beats Studio
Coby
Darth Beyer v3
Denon D7000
Koss DJ100
Koss ESP950
Fischer FA003
Sennheiser HD25
Sennheiser HD558
Sennheiser HD650
Sennheiser HD800-mod
Grado HF2
Joe Grado HP1000
AKG K240EP
AKG K270
AKG K340
AKG K601
Audeze LCD2r1
Audeze LCD3
Symphones/Grado Magnum
Audio Technica M50
V-Moda M80
PERFECTION loopback
Sony SA5000
STAX SR009
Grado SR80i-mod-cup
Grado SR225
hure SRH840
Grado RS1
Beyerdynamic T1
Fostex T20RP
Fostex T50RP-mod
Sony XB700


---
ORIGINAL POST STARTS HERE
 
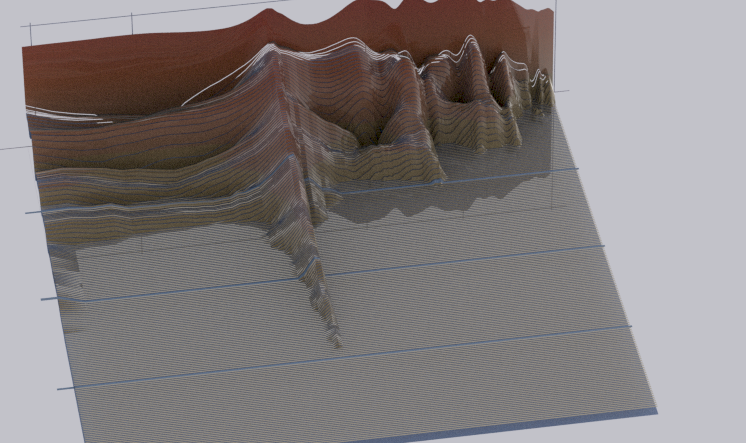
I'm been meaning to do this for while now, but finally got off my ass and unpacked my measuring gear from storage. CSD plots tell us a bit more than FR graphs. Both are great visualization tools to help us find problems (at least that's what I use them for when I build speakers, not to self-pleasure myself that my headphones are amazingly completely flat from X to Y Hz.)
 
Just a word of caution. Take these with a grain of salt. I did not perform these measurements in a laboratory quality environment, an anechoic chamber, or precisely controlled conditions. It is a serious pain-in-the ass while taking these kind of measurements to minimize reflections and artifacts. Anyone who is interested can PM me if they have any technical questions as to how I set things up. I would also advise against comparing these CSD graphs to other CSD graphs (I even feel uncomfortable comparing graphs from different measuring sessions!) There will be differences in environmental conditions, measuring methodology, and how the graphs are visualized. For example, the well-known LCD2r1 CSD graph gets cut off at -25db. These graphs go down to -50db - probably a little more than necessary - but I just wanted to see it.
 
One of the reasons I performed these measurements was because I wanted to objectively see the effect of the "Jazz mod" on the HD800s. I used two layers of adhesive lined felt instead velvet for my HD800. I only covered the metal and plastic surfaces and did not cover the grill on my HD800s.
 
 
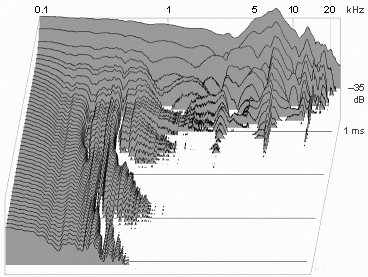
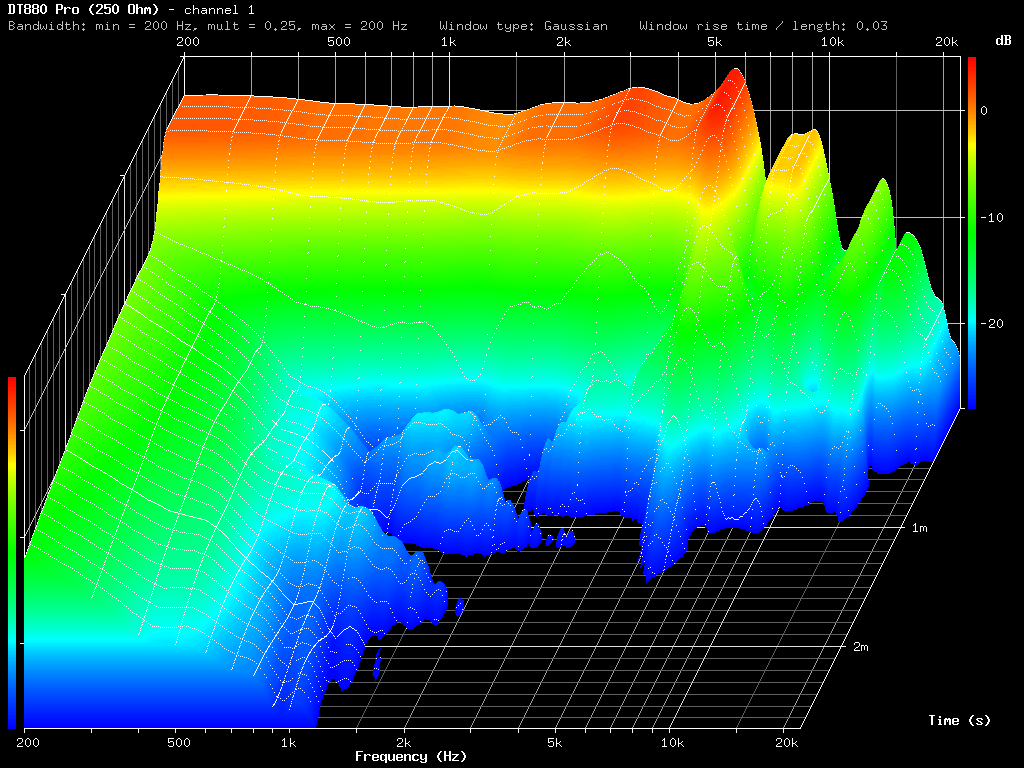
HD800 (SN# ~10000) CSD:
You can see that big ridge around the 5.5kHz area that many of us are aware of. That tiny ridge at 3kHz is looks like an artifact and is probably not audible.

 
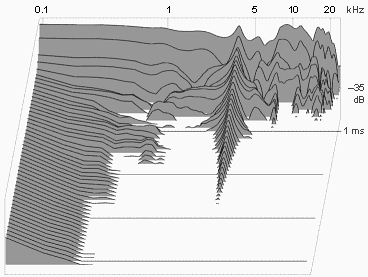
HD800 CSD with variation of "JaZZ Mod":
It's hard to see because the wide range of the Y-axis on the graph, but this mod does tone down the treble region. It also does some funky stuff at the tail-end of the "problem" area. It shifts it lower in frequency a bit, broadens the peak, and kills that last tiny bit of resonance after 2ms. Probably a very slight beneficial result overall on that specific area.
 

HF-2 CSD:
Just for kicks.


Aug 13, 2011 at 1:46 AM Post #3 of 937
Aww, poor HF-2. I think I'll keep it just because it looks awesome.
 
These are old and I certainly didn't make them, but they'll make for good comparison. They only go down to -30dB but extend to 20Hz, so keep that in mind:
 
SR-007SRM-717-Accumulate.gif

 
SRS-4040-Accumulate.gif

 
The LCD-2 one here is of a higher dB and a much lower resolution, so I question its accuracy. You even mentioned it in your OP:
 
1000x500px-LL-2072cfda_graph1.gif

 
purrin, I trust you'll do the SR-009 when you get it? Any plans to do the HP1000? 
biggrin.gif

 
Aug 13, 2011 at 1:59 AM Post #4 of 937
It'd be interesting to see how the plots change using a cheap amp versus a high-end amp.  However you should team up with Tyll on this kind of thing too I reckon.
 
Aug 13, 2011 at 2:14 AM Post #5 of 937
 
Quote:
Aww, poor HF-2. I think I'll keep it just because it looks awesome.
 
Note they go down to 20Hz, so keep that in mind.
 
purrin, I trust you'll do the SR-009 when you get it? Any plans to do the HP1000? 
biggrin.gif


LOL yeah. It does give us some insight into the Grado sound. The John Grado drivers sound lively and hyperactive, I'll have to pull up the impulse response on the HF-2s to confirm. I let a friend borrow my HP1000, I'll measure it once I get it back. And of course I do the full suite of measurements on the SR009 - whenever it comes :sigh:
 
I only went down to 1kHz on the graph, because I gated the measurement to 6ms to filter out reflections and artifacts. That LCD2 CSD graph is wierd though.
 
I've never seen that O2 CSD. It explains a lot, how fast it settles right after 1kHz.
 
 
Aug 13, 2011 at 2:15 AM Post #6 of 937


Quote:
It'd be interesting to see how the plots change using a cheap amp versus a high-end amp. 


We could certainly do that.  He's got the BA and I'm playing w/ something else very, ahem, tubelicious atm.  Is the Fiio E9 cheap enough?  Or someone could build an O2.  
biggrin.gif

 
Hey, purrin.  Want to do HP2's x3? 
 
 
Aug 13, 2011 at 2:33 AM Post #7 of 937
Quote:
It'd be interesting to see how the plots change using a cheap amp versus a high-end amp.  However you should team up with Tyll on this kind of thing too I reckon.


Speaking of Tyll, I measured these with my first headphone amp ever, a HeadRoom Total AirHead. I haven't met Tyll yet. I met Jorge though the other day, but I don't think that counts. 
redface.gif

 
I'll haul in the good stuff into my "lab" (garage) one of these days. I was too lazy tonight. It would be very interesting to compare to the BA. However, I'm thinking harmonic distortion measurements be better at demonstrating the effect of amps (especially tubes). I'm not totally set up yet for HD measurements the way I would like to visualize them: sine tones at different frequencies, and a few tri-tone tests, etc. I would graph the full spectrum RTA results instead of a HD percentage. "1.2% HD at 120Hz" doesn't mean much. But wouldn't it be interesting to see how tubes light up the harmonics, if that is indeed the case!
 
Quote:
Hey, purrin.  Want to do HP2's x3? 


Absolutely not. You said they all sounded the same. I trust your ears. Maybe.
 
 
Aug 13, 2011 at 3:18 AM Post #9 of 937


Quote:
Absolutely not. You said they all sounded the same. I trust your ears. Maybe.

 
How subjective of you.  
tongue.gif
wink.gif
  
Yes they do sound the same but it could be that they look alike.  Though mine has more lettering so it was definitely a tad more refined.  
gs1000.gif
  
 
Edit - After swapping my sources due to the QA350 failing to feed the EC Super7 adequately I decided to re-listen to the HP1000s I had on hand again.  They did indeed sound different so I asked purrin to get some measurements.  Not only did one set have less clarity in the mids and also more mid bass but was surprisingly less sensitive.  
 
Aug 13, 2011 at 3:25 AM Post #10 of 937
 
Quote:
Very cool :)  Why'd you start the measurements at 1khz?


I had to limit the time window to 6ms to avoid extraneous crap (reflections, odd artifacts, noise from my kids running around, etc.). This should have been enough to go down to a couple hundred Hz, but the plot ends up looking wierd given the extended axis ranges. I have the raw data, I'll go back and crank out a few more. It should be funny - I'll probably produce some plots that look totally different based on the same raw data.
 
EDIT: Here what it looks with with a 6ms time window and extended plot to 100Hz. I think there's some screwball stuff going on there that isn't accurate. I would need large sound proof room and mount the drivers on a large baffle to produce down to 20Hz in a meaningful way.


As I said, these measurements are such as pain. They are very susceptible to environmental conditions. Take these with grain of salt. I'll probably run these again, but use some different techniques for the mic and headphone mounting.
 
 
Aug 13, 2011 at 6:18 AM Post #11 of 937
Very interesting. Thank you for your efforts!
 
Aug 13, 2011 at 4:00 PM Post #12 of 937
 

Quote:
Very interesting. Thank you for your efforts!


TY. This is actually kind of fun.
 

     Quote:
It'd be interesting to see how the plots change using a cheap amp versus a high-end amp.  


Out of curiosity, here's an HD800 CSD comparison between the Melos and Total Airhead. Too close to call. All that blue stuff is questionable and is probably related to the environment or the limitations of my measurement techniques. Without a lot more data points, it's tough to know. I still don't think this is the right tool to measure the affect of amplifiers on headphones though.
 
HD800 <- MELOS SHA-1:

 
HD800 <- HeadRoom Total AirHead:

---
 
Here are the HF2 and SR80i for comparison purposes. The red and orange regions are interesting, but also look for uniformity, which is most critical (the ideal would start off with a red vertical line across the graph followed by successive vertical lines down all to way down to blue and black). With these plots, we can see where in the audio band these headphones have the most energy (within a certain time window.)
 
Just a few notes: The energy in the the middle of top octave of the HD800s probably isn't that objectionable. It's probably heard as more air or shimmer. Take a look at the SR80i - why are we not surprised?
 
HF2:

 
SR80i (with flat pads):


Aug 13, 2011 at 8:10 PM Post #13 of 937
Purrin, EXCELLENT!
 
I used Clio a loooong time ago while working for a speaker manufacturer, does that even run on modern PCs? :wink:. For the shifting resonances with time, it is very puzzling, I can't imagine it being anything physical but also there's not so much going on in the post-processing to explain it though (these are just ffts of the impulse response going through a moving window. I'd be interested to hear about your measuring setup (dummy head, in-ear mics ?). 
 
Finally, your measurement of the HD800 with / without foam mod is simply brilliant! I wanted to do this test while I was also looking into the mod. I had done a rough acoustic simulation of the HD800 chamber + ring driver + foam lining inside to see the impact of the added lining on the HF resonance ( http://www.head-fi.org/forum/thread/468461/hd800-imaging-and-treble-why-and-how-it-can-be-improved-upon ). Interestingly, the simulation, although very rough, could predict the resonance at around 6kHz and a 2-3dB reduction by adding some reasonably absorptive foam lining to the frame region. From your measurement, it would seem like the 2 curves have a difference 0dB ref (it being the largest level at t=0)? But we can clearly see the resonance being tamed tone through the decay curve, very nice!
 
Aug 13, 2011 at 8:34 PM Post #14 of 937


Quote:
Purrin, EXCELLENT!
 
I used Clio a loooong time ago while working for a speaker manufacturer, does that even run on modern PCs? :wink:. For the shifting resonances with time, it is very puzzling, I can't imagine it being anything physical but also there's not so much going on in the post-processing to explain it though (these are just ffts of the impulse response going through a moving window. I'd be interested to hear about your measuring setup (dummy head, in-ear mics ?). 


Arnaud, it sounds like you understand this stuff so that makes me smile! A lot of people mistakenly believe CSDs measure FR over time, whereas they are simply FFTs (measuring energy) over shrinking time intervals. As for the shifting ridges, I have no good idea why it happens. You see that in the Stereophile speaker measurements too. Maybe it has to do with how the windows are tapered at the ends of the interval, or it's simply a physical phenomena of the play between amplitude and frequency.
 
I'll explain my setup and the reasons why in a pm. 
 
Quote:
Finally, your measurement of the HD800 with / without foam mod is simply brilliant! I wanted to do this test while I was also looking into the mod. I had done a rough acoustic simulation of the HD800 chamber + ring driver + foam lining inside to see the impact of the added lining on the HF resonance ( http://www.head-fi.org/forum/thread/468461/hd800-imaging-and-treble-why-and-how-it-can-be-improved-upon ). Interestingly, the simulation, although very rough, could predict the resonance at around 6kHz and a 2-3dB reduction by adding some reasonably absorptive foam lining to the frame region. From your measurement, it would seem like the 2 curves have a difference 0dB ref (it being the largest level at t=0)? But we can clearly see the resonance being tamed tone through the decay curve, very nice!


LOL, I've seen that thread and so much wanted to test your assumptions. I'm not sure that my testing environment is suitable enough to have that kind of precision. There is a few db different though starting from around 5kHz (from memory I think.) Let me pull up raw the impulse response data and generate a few FR graphs. I'll also provide the colored topology CSDs for the HD800 with foam and without which demonstrates this more clearly. Visualization is a fun art form.
 
To be continued... (dinner time with wife and kids now)


Users who are viewing this thread

Back
Top