General Headphone measurement related discussions
May 16, 2020 at 11:58 PM Thread Starter Post #1 of 94

SilverEars

Headphoneus Supremus
Joined
Sep 18, 2013
Posts
14,455
Likes
6,475
Current Harman curves from here. Again, only intended for rough estimation purposes. Esp. if using a different HATS measurement system than the one employed by Harman.

EX_z4f1U8AA8V6_
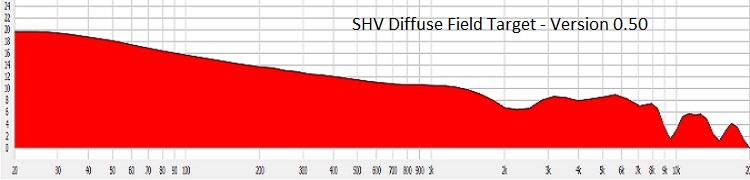
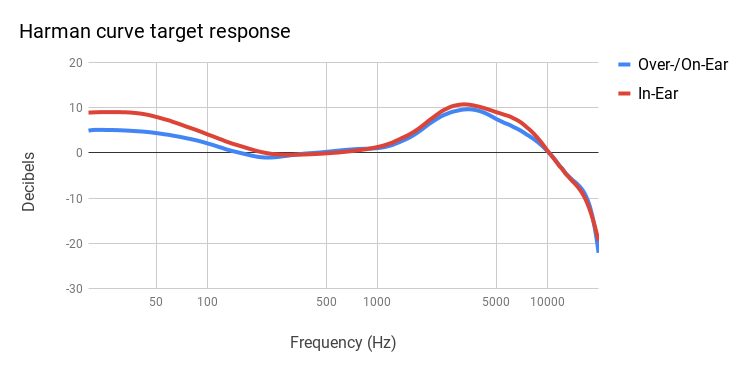
I wish there was more details in regards to placement of the frequencies of the different parts of the curve. I was looking at Rtings measurement methodology video, and they explain why the Harman curve is smoothly shaped. So, Harman curve is using a particular type of HATS (head and torso) dummy, and the turns out that way due to the dummy's head and torso shape they use after smoothing. And Rtings chooses to use diffuse field result from their dummy for their treble region, hence the wobbly looking target response. So, these target curves are based on the dummy that was used to obtain the target curve! quite interesting I say.


I often go to a Korean website called 0dB for any interesting review/measurements I can get, and I've noticed that they use GRAS 45CA and they go over all the insights behind their measurements and their equipment which I found to be interesting read. Google translate to get English translations.

What I find interesting that 0dB points out is the difference between 45CA and HATS in how the response results.

https://www.0db.co.kr/BOARD_0DB/498388

I also find Speakerphone's measurement methodology an interesting read as well. He discusses ear sizes and the effects on consistency of measurements.

https://clarityfidelity.blogspot.com/2015/05/introduction-measurement-procedures.html

Articles on Soundstage website. Why Mini-DSP Ears measurements arn't reliable, etc..

https://www.soundstagesolo.com/index.php/features/152

https://www.soundstagexperience.com...se-menu/850-a-crisis-in-headphone-measurement
 
Last edited:
May 17, 2020 at 2:39 AM Post #2 of 94
There are no real shortcuts to the solution of what a loudspeaker sounds like in a good room. If that's really what Rtings believe that a neutral headphone and target frequency response curve should sound like, then they should get off their butts(!), and do some actual measurements like Harman and Tyll did, with a few minor adjustments...

First and foremost, they should measure the response of the JBL M2's (or another good speaker like the high-end Genelecs) calibrated to an anechoically flat response, rather than calibrated to Harman's preferred in-room response (which is what Tyll measured). Nobody other than Harman really gives a damn what their preferred house sound is. What I (and I suspect many others) would really like to know is what the M2 and other good loudspeakers with an anechoically flat response sound like in a good room. I say other speakers as well, because there are variations in the dispersion of the higher frequencies between speakers, due to mechanical differences in the tweeter designs.

2nd, they should do a battery of measurements from different locations in the room, with different levels of room reflectance, and with or without obstructions (most people listen from a chair or couch rather standing in the middle of room). And also take the same measurements in different sized and shaped rooms as well.

All the above measurements should be taken from inside the ears of their HATS system, and also their staff members who are used for the bass measurements, if possible. Any discussion of what a speaker does or does not sound like in a room is largely conjectural until we have some actual data like the above to study and look at.

Measurements alone probably won't do it though. Because the mechanics of how sound is created in a headphone, and how it's created by loudspeakers in a room is quite different. And there may be other factors that influence our perceptions of what a speaker sounds like in a room which cannot be easily replicated or accounted for solely by taking measurements of same. Iow, there may also be a little bit of "art" involved in approximating those perceptions, in addition to the science. That's why blind subjective perceptual tests have to be performed as well to ultimately get to that most ideal curve or curves.

Right now, all Rtings is doin is using shortcuts as a way of trying to work around the above, which could work. Or it could not. Without some actual data, we really have no way of knowing either way.
 
Last edited:
May 17, 2020 at 3:50 AM Post #3 of 94
There may be some ways of making some educated guesses about the above though, which can be done without taking actual measurements of loudspeakers. Here is a quick list of some of them...

1. Compare the free-field and diffuse field responses of the two measuring systems, and compute a difference curve from them. And apply that as a correction to the current Harman target.

2. Compare the measured responses of several different headphones on the two systems, and do the same thing.

3. Compute a target response curve based on a sampling of what are generally considered to be the most neutral-sounding headphones in the Rtings database.

4. Do some subjective testing with different individuals and headphones to experimentally determine the above, using some basic tone controls to further refine the results.

5. Create a better model for a "room sound", which is based on weighted free-field samples from a variety of different angles for each ear + an appropriate room curve.

6. Use some combination of the above.

With the possible exception of the last one, each of the above has some potential advantages and disadvantages.
 
Last edited:
May 17, 2020 at 12:36 PM Post #4 of 94
There are no real shortcuts to the solution of what a loudspeaker sounds like in a good room. If that's really what Rtings believe that a neutral headphone and target frequency response curve should sound like, then they should get off their butts(!), and do some actual measurements like Harman and Tyll did, with a few minor adjustments...

First and foremost, they should measure the response of the JBL M2's calibrated to an anechoically flat response, rather than calibrated to Harman's preferred in-room response (which is what Tyll measured). Nobody other than Harman really gives a damn what their preferred house sound is. What I (and I suspect many others) would really like to know is what the M2 and other good loudspeakers with an anechoically flat response sound like in a good room. I say other speakers as well, because there are variations in the dispersion of the higher frequencies between speakers, due to mechanical differences in the tweeter designs.

2nd, they should do a battery of measurements from different locations in the room, with different levels of room reflectance, and with or without obstructions (most people listen from a chair or couch rather standing in the middle of room). And also take the same measurements in different sized and shaped rooms as well.

All the above measurements should be taken from inside the ears of their HATS system, and also their staff members who are used for the bass measurements, if possible. Any discussion of what a speaker does or does not sound like in a room is largely conjectural until we have some actual data like the above to study and look at.

Measurements alone probably won't do it though. Because the mechanics of how sound is created in a headphone, and how it's created by loudspeakers in a room is quite different. And there may be other factors that influence our perceptions of what a speaker sounds like in a room which cannot be easily replicated or accounted for solely by taking measurements of same. Iow, there may also be a little bit of "art" involved in approximating those perceptions, in addition to the science. That's why blind subjective perceptual tests have to be performed as well to ultimately get to that most ideal curve or curves.

Right now, all Rtings is doin is using shortcuts as a way of trying to work around the above, which could work. Or it could not. Without some actual data, we really have no way of knowing either way.
I'm confused what you mean by do measurements. The video I posted earlier shows him discussing how Rtings arrived at their target curve based on the result from the HATS in a diffuse field.

Why JBL M2 specifically? Do you find it to be a very accurate monitor? Tyll's finding flat video shows the angle the speakers has to be to focus the sound, particularly the high frequencies due to directivity.

I guess experimenting with various speakers to see if HATS put out differences would be interesting. First you measure the speaker response, and then use HATS. Like you find various speakers that measure flat, that may measure differently on HATS. Not sure if that's possible.

I understand experimenting with different rooms is warranted, but wouldn't there be an ideal room size to the type of speaker? And therefore an ideal room effect level?

Do you have any information on what measurement process Harman has gone thought to arrive at their curves and their updates? I'd like to find out more about the process.

The shortcut I've seen Rtings take is modify their curve like Harman outside the treble and upper-mids rise, which was based on their free field measurement.

One thing is the take-away from this is that Harman and Rtings has different head dummies. lol In which the target depends on.

There may be some ways of making some educated guesses about the above though, which can be done without taking actual measurements of loudspeakers. Here is a quick list of some of them...

1. Compare the free-field and diffuse field responses of the two measuring systems, and compute a difference curve from them. And apply that as a correction to the current Harman target.

2. Compare the measured responses of several different headphones on the two systems, and do the same thing.

3. Compute a target response curve based on a sampling of what are generally considered to be the most neutral-sounding headphones in the Rtings database.

4. Do some subjective testing with different individuals and headphones to experimentally determine the above, using some basic tone controls to further refine the results.

5. Create a better model for a "room sound", which is based on weighted free-field samples from a variety of different angles for each ear + an appropriate room curve.

6. Use some combination of the above.

With the possible exception of the last one, each of the above has some potential advantages and disadvantages.
In the video above, they do show free and diffuse field results, but their is a reasoning behind the choice of diffuse field over free field, which is also what Harman has done. I think the reasoning for diffuse field does make sense.

I found your information about HATS ear-canal resonances interesting. GRAS rigs would show different responses due to their couplers. What I'm getting from 0dB article from above is that GRAS couplers have better accuracy.
 
Last edited:
May 17, 2020 at 1:28 PM Post #5 of 94
There is more information out there about how Harman has done their studies in the articles on Inner Fidelity and other sites. In Sean Olive's blog, and Harman's white papers. And in their PDF presentations to various other instutions and entities within the trade. Harman doesn't release all of the details about their methods and practices. But they release quite a bit of it to both the public and also their piers in the trade for review. So it isn't that difficult to find.

Here is one fairly recent powerpoint presentation that goes into a bit of detail on some of their testing methods and procedures as an example...

https://www.listeninc.com/wp/media/Perception_and_-Measurement_of_Headphones_Sean_Olive.pdf

There are others as well, which I'd have to spend some more time digging around for. Some of the material is referenced on Sean's blog and Twitter feed though. And in other articles about their tests.

The reason Harman is releasing alot of this info into the public sphere is that they are trying to establish some new standards within the trade for both the measurement and development of new headphones. Just as they did (with Floyd Toole's help) for loudspeakers via their "spinorama" method, which rates both the on and off-axis performance of in-room transducers. If you want to gain a better understanding of the latter, ie the accurate reproduction of sound via in-room loudspeakers, then there is probably not much better a teacher for that particular subject than Mr. Toole.

This video is somewhat biased toward Harman's philosphy and approach to product development. But it gives alot of info about the above. And also goes into some of the more thorny aspects of sound reproduction generally (ie the so-called "circle of confusion"). And it explains why JBL's M2 has become one of the standards within the trade for an anechoically flat speaker response. So it's not a bad to place to begin, if you want to gain a better understanding of these things.


The presentation is a bit long, and dry. But it has quite a bit of useful, practical information on these topics. There are also white papers which have been made available to the trade by Mr. Toole and the research team at Harman which go into even more detail, which are also worth seeking out.

Edit: Interesting article from Stereophile (one of Inner Fidelity's sister sites) from Jan 2019, related to the above...

https://www.stereophile.com/content/blind-listening-harman-international
 
Last edited:
Jun 1, 2020 at 6:13 PM Post #6 of 94
Average Frequency Response of 5 Popular Lower-Cost Closed Studio Headphones Based on Rtings Raw FR Plots:

5STUDIOHEADPHONES.jpg


FYI, the above plot was created using the same proportions and units as the Rtings graphs linked below. So the amplitude range on the vertical axis is 55 to 115 dBs. And frequency range on the horizontal axis is 10 Hz to 20 kHz. Since I was doing all the plotting manually (in Windows Paint), without the aid of any actual graphing tools, I first had to create a higher precision semi-log graph, with more discrete increments than the usual FR graph. The brightest horizontal lines are spaced 10 dB apart. While the brightest vertical lines correspond to the usual increments of a typical log frequency graph (ie 10, 20, 30 Hz, etc. for the 1st decade, and 100, 200, 300 Hz, etc. for the 2nd decade, and so on). The next brightest lines divide those units in 1/2. And the darker lines represent progressively smaller increments. All the above were calculated mathematically to ensure the highest level of precision possible.

The white dots on the graph represent the sampled frequency points for all the headphones. A total of 55 samples were taken for each headphone (from the Rtings graphs linked below). The spacing between the samples gets smaller in the upper midrange and treble though, to allow for better precision in that area. So they are not uniform across the entire frequency range. The samples for all the headphones were first compiled on a spreadsheet. Then the average value of the samples in dBs was computed for each of the frequency points on the above graph.

Current Harman Targets for Comparison:

EX_z4f1U8AA8V6_


The headphone curves used to the create the first graph above are:

AKG K371 (Right Channel)
https://www.rtings.com/headphones/1-4/graph#1671/4012

AUDIOTECHNICA M50X (Right Channel)
https://www.rtings.com/headphones/1-4/graph#295/4012

BEYERDYNAMIC DT-770 PRO (Right Channel)
https://www.rtings.com/headphones/1-4/graph#440/4012

SENNHEISER HD 280 PRO (Left Channel)
https://www.rtings.com/headphones/1-4/graph#299/4011

SONY MDR-7506 (Right Channel)
https://www.rtings.com/headphones/1-4/graph#386/4012

Each of the above headphones has its own "personality" as they say. But there are a few features that most of them have in common, which stand out on the above plot.

First, they all have a fairly sizable bass bump. Though the AKG K371's is lower down in frequency than the rest of the headphones.

Second, they have a fair amount of brightness in the treble at around 9 kHz. The AT M50X is the least bright though in that range. And I consider some degree of resonance in that range to be normal for a neutral headphone response on the Rtings plots.

Third, they are fairly rolled off in the upper treble region, except for the Beyer DT-770.

Imo, the above headphones are all close to a neutral response. But they all deviate a bit from a neutral response in different ways. So there may be some other combinations of headphones which could potentially yield a more neutral result than the above. Imo, the average response of these 5 headphones is probably a little on the smiley side, which might be useful for lower volume listening, except for the fact that it is so rolled off in the upper treble, and missing some "air" in that region.

The Harman curve should only be used for rough estimation purposes btw. Especially in the treble, where it may do a poorer job of modeling the characteristic resonances of other head and torso measuring systems.
 
Last edited:
Jun 12, 2020 at 1:40 AM Post #7 of 94
3. Compute a target response curve based on a sampling of what are generally considered to be the most neutral-sounding headphones in the Rtings database.

16HPS.jpg


Still tweaking the list of headphones in my sampling. But the above curve, which is the average of 16 neutralish headphones in the Rtings database, is beginning to exhibit many of the features I'd associate with a neutral response, including resonances near the proper levels and frequencies in the bass, upper midrange and treble. And also some depressed areas that roughly follow a similar curve.

I also increased the number of samples for each headphone in the upper treble in an attempt to resolve a bit more detail there. So there are now a total of 65 samples for each headphone.
 
Last edited:
Jun 12, 2020 at 2:08 AM Post #8 of 94
Jul 3, 2020 at 3:50 AM Post #9 of 94
A couple new curves based on some other samplings of neutral headphones from the Rtings raw FR curves...

13HPSAVERAGE.jpg


This plot is the average of 13 neutralish curves. The bass looked a little too "flat" to me in the last curve, so I made a few tweaks to the list of headphones in the sampling to try to adjust that a bit. This is pretty similar to last curve though. The rise from the midrange to the bass is just a tad more gradual. And there's a little more of a peak in the bass. And the treble is just a shade brighter. But the features of the two curves are substantially similar.
 
Last edited:
Jul 3, 2020 at 4:32 AM Post #10 of 94
19 HPS AVERAGE.jpg


This plot is the average of 19 neutral-ish headphone curves. And includes a number of other headphone curves not included in either of the last two plots, some of which have a slightly darker tilt than in the previous samplings. The differences are quite subtle. But there's a little more elevation in the lowest part of the bass. And a bit less of a tilt in the "valley" in the midrange. The upper treble is also just a hair brighter than the previous plots.

The fact that the curves are all pretty similar in terms of their general features (despite being composed of different groups of headphones) suggests to me that these are getting pretty close to a neutral response.

All three plots included at least one open-back headphone btw. The last two plots above both included the left channel of the Senn 58x in their samplings, for example. I did that to try to tame the bass levels a bit, because I thought some of the closed-back HPs might be gettin a bit too bassy. I'm not sure that's really necessary though with such a large headphone sampling. So I want to do one more plot without that, and just closed headphones. Too tired to get to it tonight though.

I still need to re-verify my math on the previous two graphs. But just for fun, I also computed the difference between the last curve above, based on the average of 19 headphone measurements, and the right channel of the AKG K371, to see how close they are...

K371 RIGHT DIFFERENCE.jpg


The green line represents the target curve, and the purplish line with the white dots is the difference between the K371's right channel and that target curve. Compare the purple curve above to the thin gray curve on this Rtings compensated graph...

https://www.rtings.com/headphones/1-4/graph#1671/3992

They are quite similar, particularly in the bass and midrange. The bass on my plot goes all the way down to 10 Hz though, instead of just 20 Hz on the Rtings compensated graph.

The main difference is in the treble. The K371 performs better in the treble on my difference plot, because my target curve is less bright in that area than the Rtings target response curve. Imo, the Rtings target curve overestimates the brightness of a neutral response in that region.

The points of fluctuation are very similar on both curves though.
 
Last edited:
Jul 16, 2020 at 2:23 PM Post #11 of 94


The above curve based on 19 neutral-ish HP measurements vs. the 2004 Olive-Welti curve (top), and most recent Harman over-ear target (bottom).
 
Last edited:
Oct 30, 2020 at 1:54 PM Post #13 of 94
I'm starting to get what my circumaural target response would be like. It would be gradual rise to 3k (I don't believe 3k should be the maxima) and around 5k, gradual decline after. I don't think a lot of us want a peak at 6k, so it makes sense for SPL to decline before that and then 7-10k as well being lower SPL as well. 7-9k should be lower than 6k, but not too low as we need sufficient amount of high-hat response with metal instruments.
 
Last edited:
Nov 27, 2020 at 7:48 PM Post #14 of 94
One measurement I've never seen measured is the Sennheiser Orpheus HE-1. I've found out somebody has measured the headphone, and it was Crin at Crinacle.com

Here is the link his article for reference. https://crinacle.com/2020/11/19/sennheiser-he-1-review-59000-summit/

I want to point out how close it's response looks to Harman target. I find it interesting that Sennehiser's HD650/600 has such responses, and I wonder if there is some tuning philosophy at Sennheiser behind such responses?


HE-1.jpg
 
Nov 27, 2020 at 11:50 PM Post #15 of 94
I'm starting to get what my circumaural target response would be like. It would be gradual rise to 3k (I don't believe 3k should be the maxima) and around 5k, gradual decline after. I don't think a lot of us want a peak at 6k, so it makes sense for SPL to decline before that and then 7-10k as well being lower SPL as well. 7-9k should be lower than 6k, but not too low as we need sufficient amount of high-hat response with metal instruments.

Is there a particular headphone that you think fits the above model well?

One measurement I've never seen measured is the Sennheiser Orpheus HE-1. I've found out somebody has measured the headphone, and it was Crin at Crinacle.com

Here is the link his article for reference. https://crinacle.com/2020/11/19/sennheiser-he-1-review-59000-summit/

I want to point out how close it's response looks to Harman target. I find it interesting that Sennehiser's HD650/600 has such responses, and I wonder if there is some tuning philosophy at Sennheiser behind such responses?

My guess is they were originally aiming for something close to a diffuse-field response. I'm sure they are also aware of the work by Olive-Welti and Harman though. And probably do extensive in-house testing as well.
 
Last edited:

Users who are viewing this thread

Back
Top