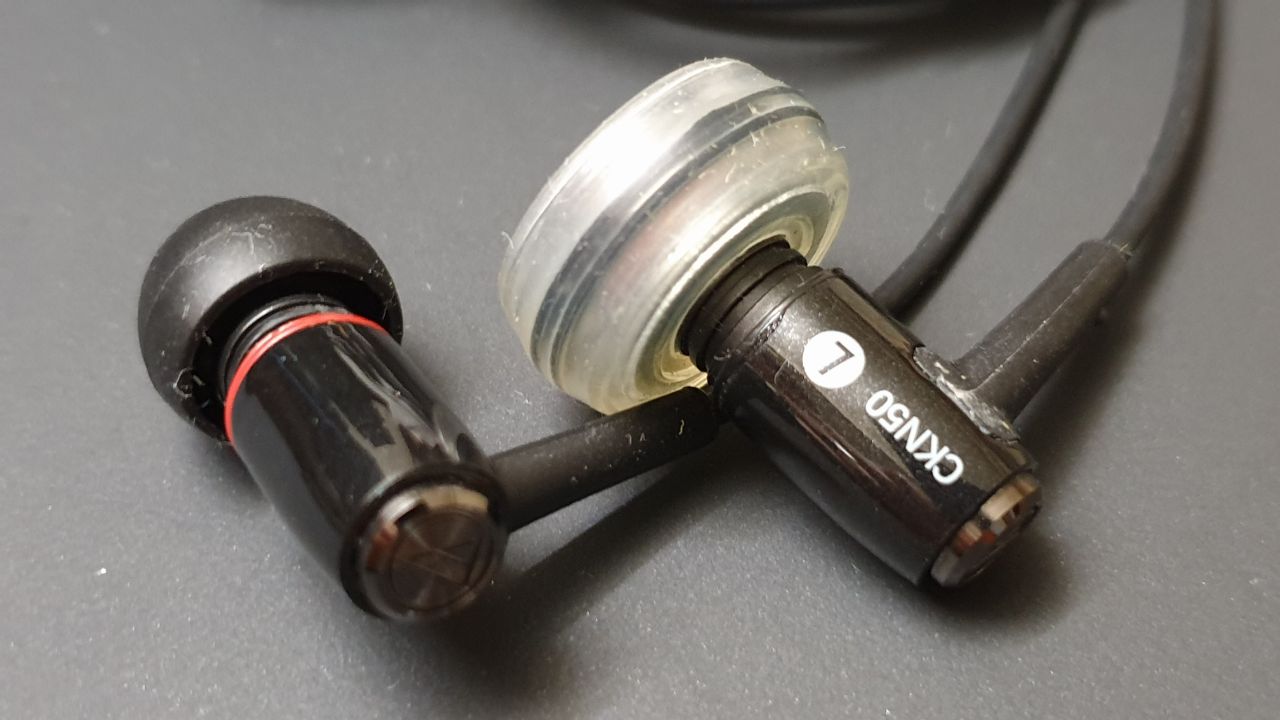
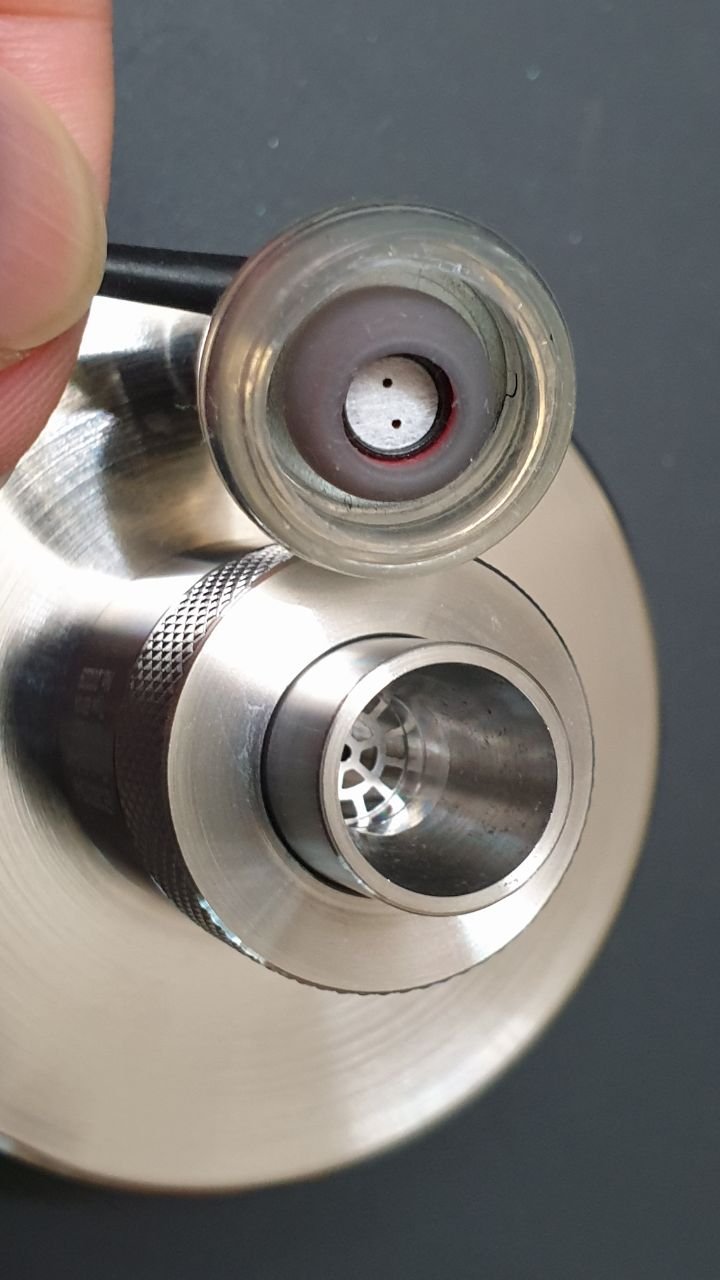
I've inserted the tip to the coupler's edge. I've seen yours and the tip's edge was slightly out. I wonder how much difference that makes? Since you used medium, does it negate the effect I wonder?
I've inserted the tip to the coupler's edge. I've seen yours and the tip's edge was slightly out. I wonder how much difference that makes? Since you used medium, does it negate the effect I wonder?
I used the smaller of the two tip sizes, so I think we're all good. I think what you saw was a trick of the camera angle and/or lighting on the chamfered edge of my coupler. I think I had the eartips inserted just slightly inside the coupler lip. If you look at our measurements on the same scale, my first resonance peak is at about 11.5 kHz; yours is at about 10.8 kHz. So actually, you can't have had them inserted quite as far in as I did. But we're talking tiny differences here. Assuming the speed of sound is the same where you are, say 330 m/s, then 2*delta ~ c/10.8 kHz - c/11.5 kHz => delta is less than 1 mm. So we're pretty close
I used the smaller of the two tip sizes, so I think we're all good. I think what you saw was a trick of the camera angle and/or lighting on the chamfered edge of my coupler. I think I had the eartips inserted just slightly inside the coupler lip. If you look at our measurements on the same scale, my first resonance peak is at about 11.5 kHz; yours is at about 10.8 kHz. So actually, you can't have had them inserted quite as far in as I did. But we're talking tiny differences here. Assuming the speed of sound is the same where you are, say 330 m/s, then 2*delta ~ c/10.8 kHz - c/11.5 kHz => delta is less than 1 mm. So we're pretty close
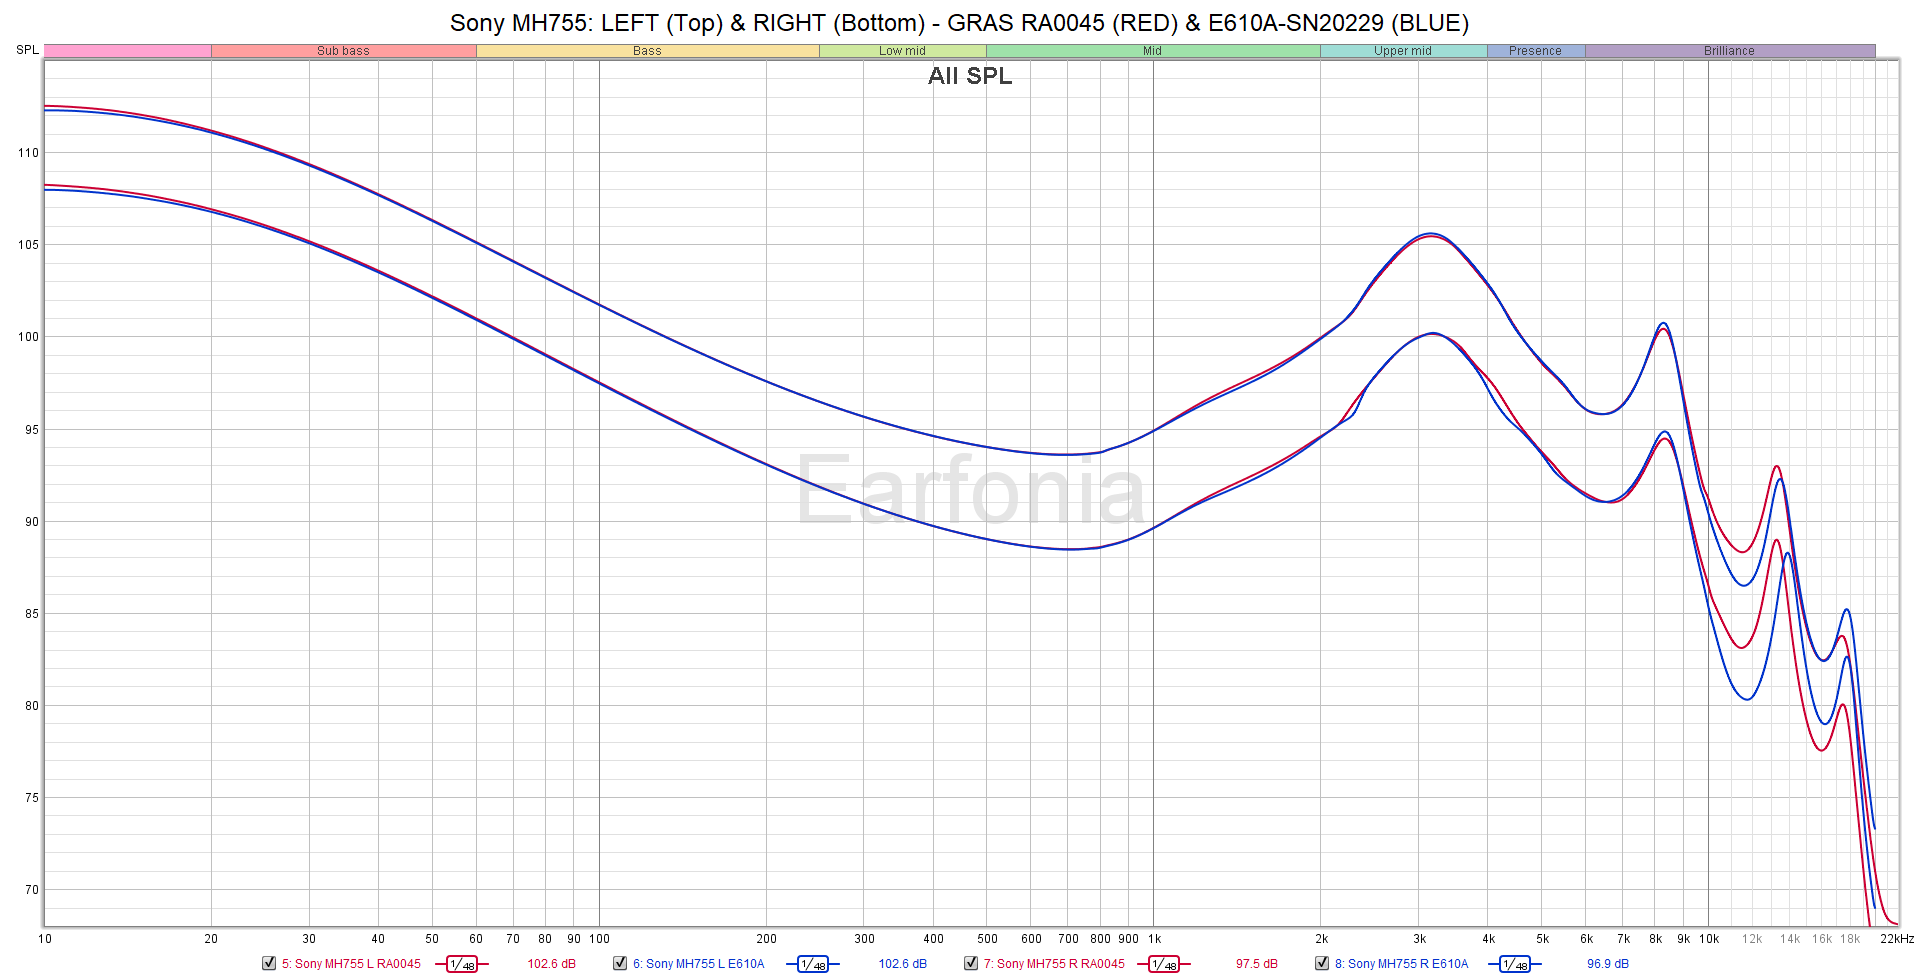
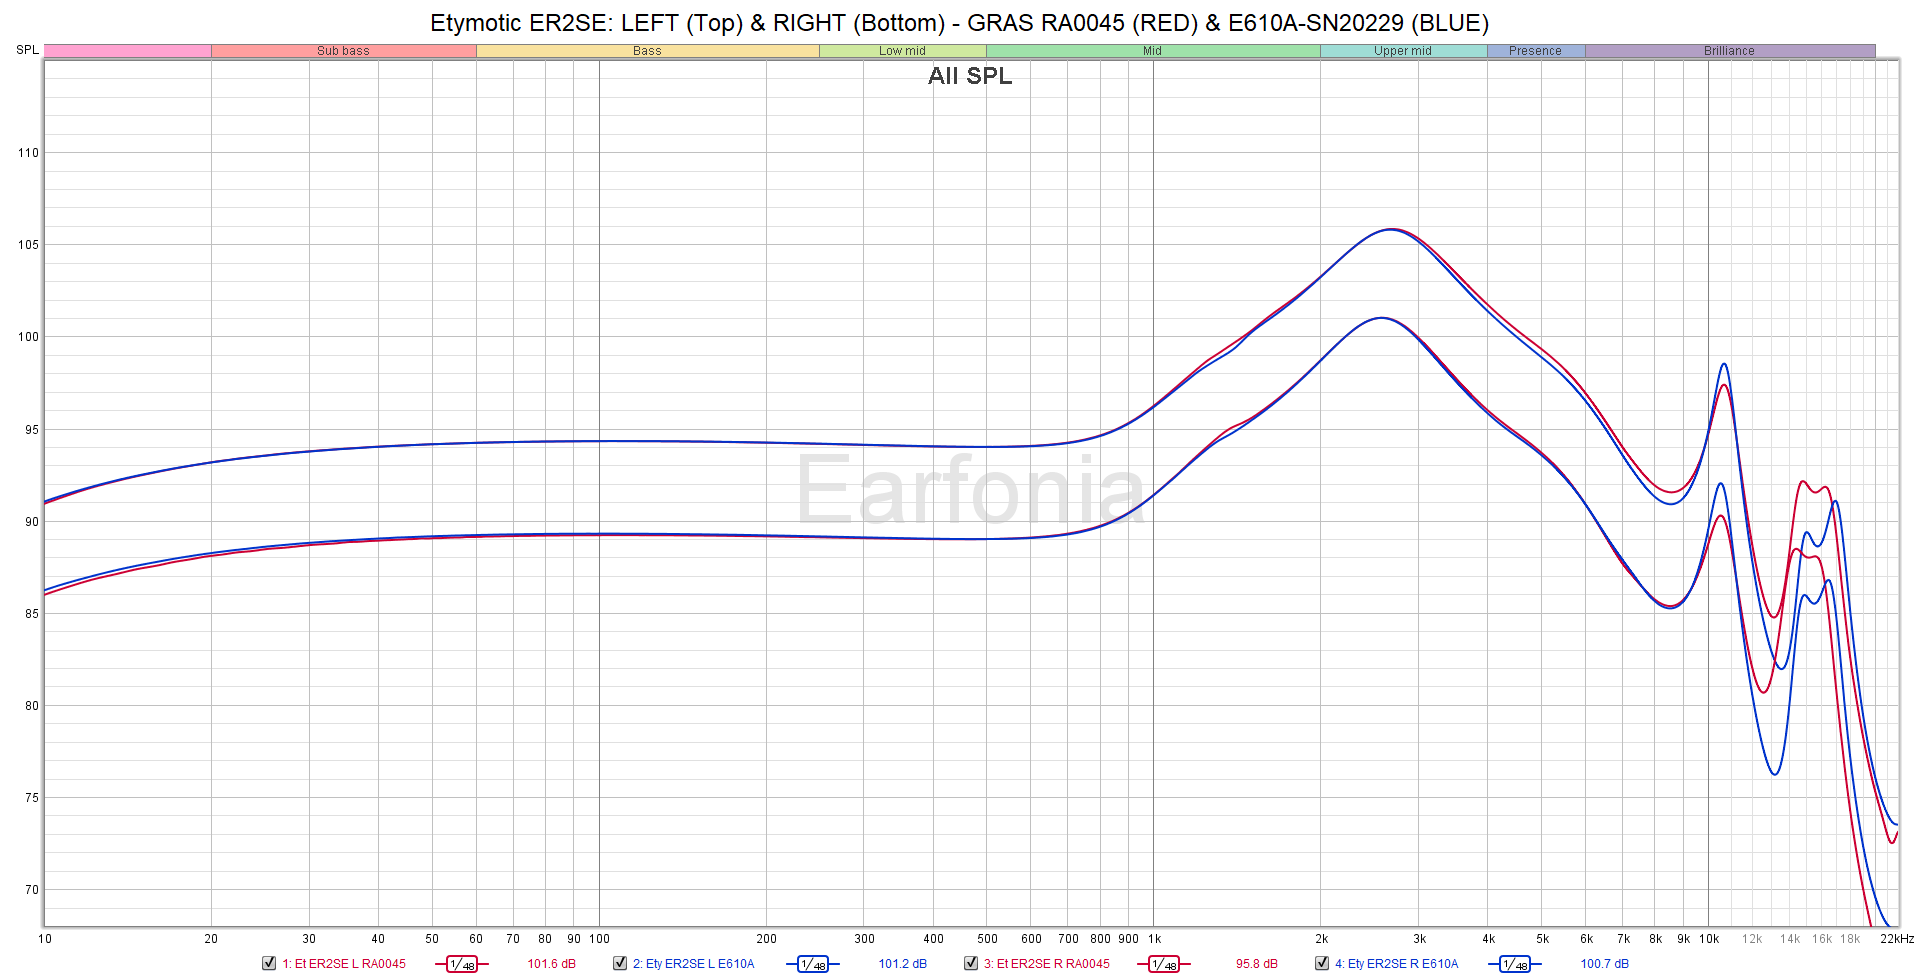
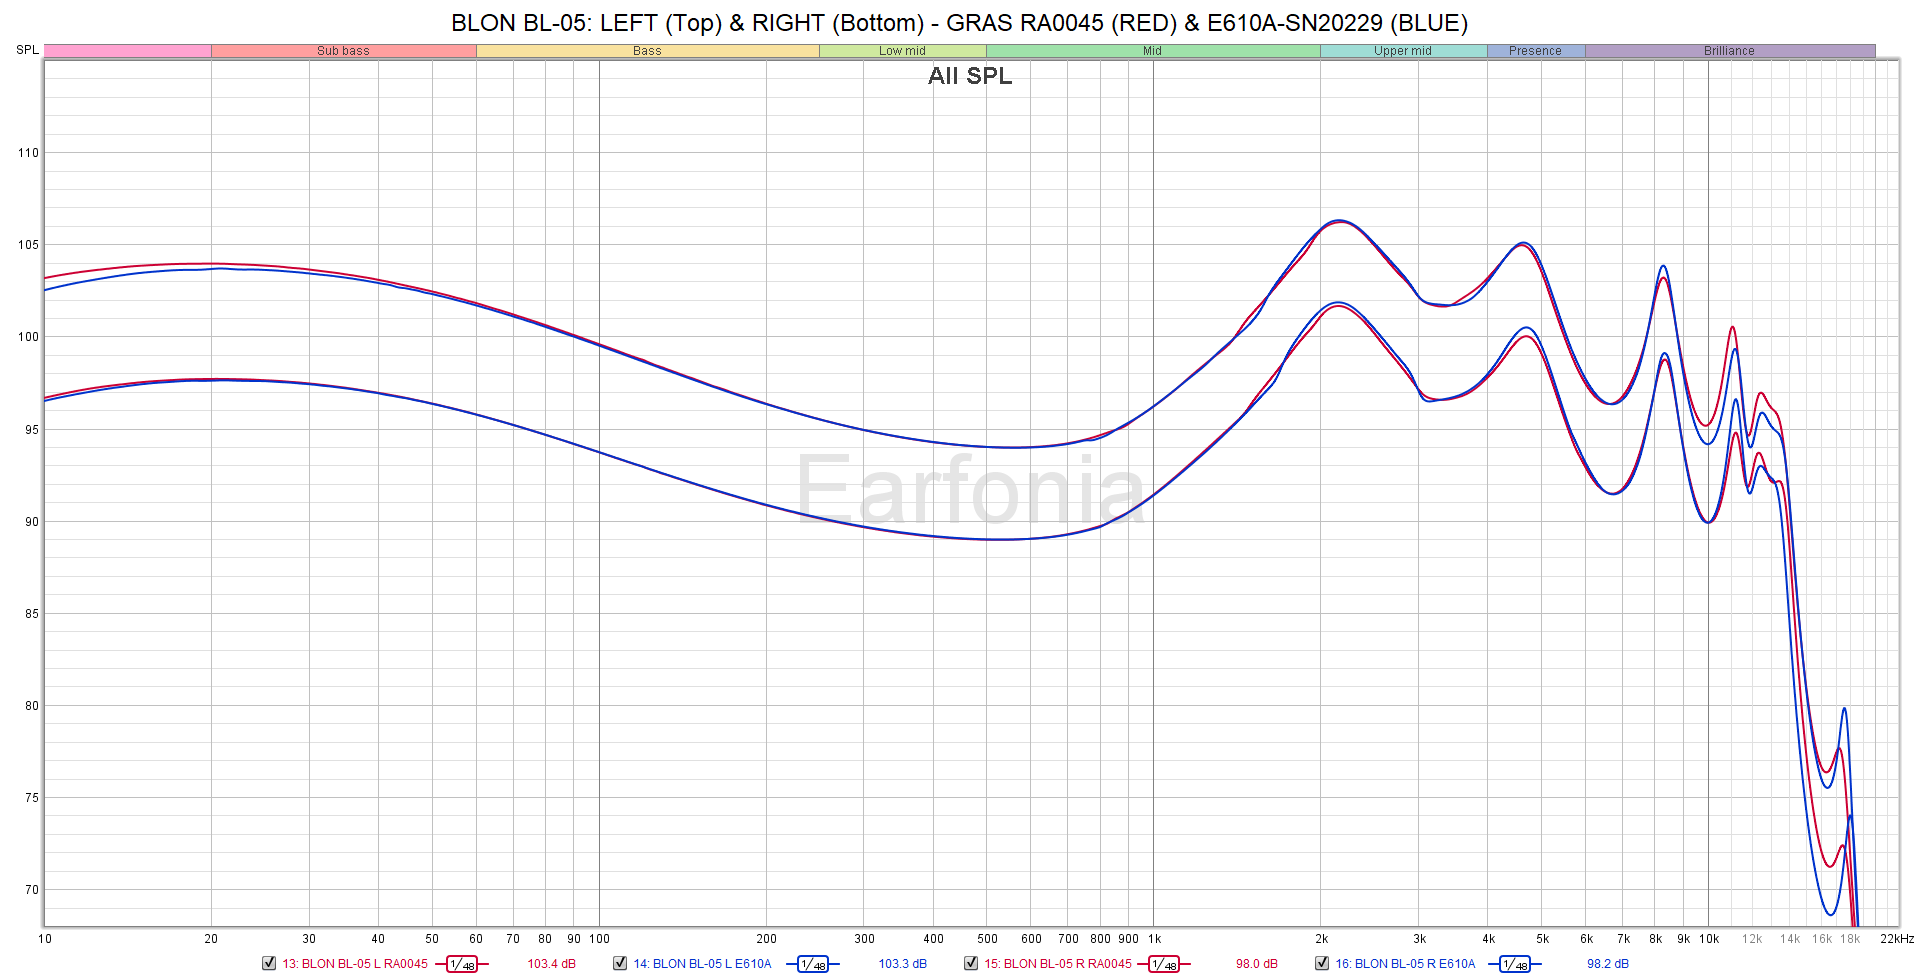
I've conducted some measurements of the ER2SE and ER4XR, and the other iems (MH755, etc..). I will be adding a Samsung AKG EO-IG95 to this tour iem package for others to play around with. Also the fake MH750 I've obtained from Ebay. Which are all included in these measurements as well. All the measurement data are uploaded to the shared drive.
The rig doesn’t look like it’s calibrated. It’s not clear how loud those IEMs are really playing. There was a comment earlier about the frequency response measurements being different depending on playback level on one model. If I’m not mistaken, one of our objectives for this tour is to come up with a common calibration so that the measured levels are clear and consistent.
If you look at some well-known measurement databases online, you’ll see that several of them adhere to the IEC 60268-7 test level (94 dBSPL at 500 Hz):
We don’t have to follow suit, but if we do decide to agree on a common testing level, IEC 60268-7 is as good as any. While you still have the tour’s ER2SE and MH755 with you, it might be a good exercise for us all to help you to be the first to come up with with frequency response and distortion measurements at the IEC standard test level.
So how can you start doing that? It looks like you have an ER4XR, which comes with a performance report in the box. It’ll show how loud the ER4XR is when the voltage at the 3.5mm plug is 200 mV rms for a 1 kHz sine. If you feed that signal to the ER4XR inserted at the reference plane, you can tell REW the corresponding SPL for the signal it’s reading from the coupler’s mic.
There are some gotchas, though. That sensitivity measurement wasn’t made with the same kind of ear sleeves as what’s in the box, but a mold to make the test quick and repeatable. If I were to guess from the measurements I’ve seen online, it’s like a large triple-flange tip permanently installed in the coupler. So if you calibrate REW using the SPL on the performance report, you shouldn’t be too far off--around 105 dBSPL if I'm remembering it right.
To produce the 200mV signal, it’ll help to have a multimeter that can make accurate rms measurements at 1 kHz. Some cheap ones only guarantee 50-60 Hz. Check the multimeter’s spec sheet for its frequency response or bandwidth. Another useful item is a 3.5mm jack splitter so you can set the voltage when the ER4XR is the load. Or if your headphone amp has low enough output impedance, you can just set its open-circuit voltage and be assured that it won’t change much when the ER4XR is connected.
It might be instructive to compare your frequency response measurement with the one from the ER4XR’s performance report. If it's unavailable, maybe you can try the same thing with the tour ER2SE. Calibration data was supplied back in post #1.
After you finish setting up REW and the test rig, it’s probably a good idea to see REW’s SPL reading for a 200 mV, 500 Hz sine, just to see if it agrees with the frequency response plot. Before you send the IEMs back, it might be wise jot down some of the setup details like the volume levels in Windows and any external headphone amp.
When I get my turn, I would probably take a few IEMs in my possession and write down the voltage level that produces the same SPL as the tour ER2SE. Either that or make a note of the SPL recorded by REW when fed the same 200 mV signal, so that I’d have a “copy” of the reference level that I can reproduce after I send the package away.
Yes, it’s more work. But if the tour participants agree on testing levels, we can be more confidence when talking about distortion measurements done at such and such dB SPL.
About the distortion measurements: Tyll used to test at 90 dB and 100 dB SPL when he ran InnerFidelity. The other sites test at 94 dB at 500 Hz. I suppose we could optionally add another test at 100 dB just to see how much worse the distortion gets. It might be instructive to see the difference between distortion measurements made by the sweep vs. stepped sine.
After making a quick trial run with the sweep to make sure the output looks right, I’d probably run it again with length = 1M and 8 sweeps. For stepped sine testing, the maximum settings will take a very long time to complete. Maybe 12 points per octave and 2 averages gives good enough resolution. But I’ll go with whatever details y’all decide.
About that MH750: Maybe it isn’t fake, but rather defective. It looks like it could be a busted front vent. Bass rolls off very quickly when the hole is too large. It’s essentially an IEM with a poor seal. The response just looks flat because the MH750 is really bassy to begin with, and the severe roll-off just cancels it. Perhaps partially covering the front vent will restore the bass response. Or you could open it up and compare with a real one.
I didn’t see the link for the shared drive. Is is public?
Thanks for the tip, I haven't gotten to calibrating the SPL meter yet. @csglinux recommened the same to me, based on a known measurement graph with voltage input information. I measured one iem with different volume levels and didn't see it change. My measurements right now do not reflect accurate dB levels from the readings, and also I normalized the overlays at 1kHz by offsetting the graphs at the common point.
Does anybody have extensive experience with testing iem response with various volume levels? If so, is there a change in the response depending on the volume? From normal listening level to the testing standard of 94dB? I'm curious if there any evidence out there to prove it.
Another useful item is a 3.5mm jack splitter so you can set the voltage when the ER4XR is the load. Or if your headphone amp has low enough output impedance, you can just set its open-circuit voltage and be assured that it won’t change much when the ER4XR is connected.
that's obviously good practice to measure the voltage at the actual load. but as you also mention, in practice that's often not necessary. I mean even if someone was wrong by a full doubling of voltage, that would still be only 6dB which for a calibration is already pretty usable given how we'll often add or remove a few dB just with how far we are from the mic. usually when I check unload vs loaded, for all intent and purposes the results are about the same around 1kHz or 500Hz. I would worry if the measurement/calibration was done at 50 or 60Hz though, as a small load can mess things up quite a bit depending on the amp. that's one reason why I quite like the 300-500Hz area.
When I get my turn, I would probably take a few IEMs in my possession and write down the voltage level that produces the same SPL as the tour ER2SE. Either that or make a note of the SPL recorded by REW when fed the same 200 mV signal, so that I’d have a “copy” of the reference level that I can reproduce after I send the package away.
that's what I did the first time I got an ER4. did it again when I bought the er4sr, and checked the few other measurement "methods" I had come up with to see if I could still count on them when I felt lazy. for example, my sure voltage is 0.4V at 1kHz, it's high enough that I can measure stuff even with my cheap multimeter, and I can get loud enough on almost any IEM, so that's my not too dangerous starting point. here is how I added comments to all my 2017 REW measurements: here for the Fiio EX1
-19.7dB was how to get 90dB @1kHz starting with 0.4V(my easy ref), in this example it's obvious that the resulting voltage to go down about 20dB would be 1/10th of it, but sometimes it's not so obvious so I wrote it down to avoid having to calculate each time. "711" was just to say I wasn't using a silicone tube as a coupler. "XXXraw" is the name of my calibration file(and not a porn title) used with that complete setup to kind of get a RAW measurement(or so I hoped^_^). and "Z" is just to say not to apply C weighting on this. not super official, but I got used to that and it did save me a lot of time since.
About the distortion measurements: Tyll used to test at 90 dB and 100 dB SPL when he ran InnerFidelity. The other sites test at 94 dB at 500 Hz. I suppose we could optionally add another test at 100 dB just to see how much worse the distortion gets. It might be instructive to see the difference between distortion measurements made by the sweep vs. stepped sine.
I can tell you right now that it's too high for me. 94dB at 500hZ that's going to be some 15dB louder near 3kHz on many IEMs. my mic, which is not a high SPL coupler measurement mic, shows its clear dissatisfaction in a THD graph. ^_^
of course I'm willing to play whatever game you set for the collective data, but be warn that on my Frankenstein creature will most likely show the mic's distortions in the midrange instead of the IEM's. (and I'm not very motivated to do a stepped sine measurement with IEMs reaching above 115dB SPL TBH!!)
If you look at some well-known measurement databases online, you’ll see that several of them adhere to the IEC 60268-7 test level (94 dBSPL at 500 Hz)...
Good information - thanks @yuriv! I'd have no objection to a 94 dB @ 500 Hz reference level for FR. I don't think our FR will change too much, as long as we're all in the ballpark. I did find one IEM that shows a strong variation in FR at higher SPLs (4th spoiler link here: https://www.head-fi.org/threads/audio-measurements-on-a-headfi-budget.893084/) but we shouldn't have any major issues like that with the ER2SE. I'm not that familiar with these Sony IEMs though. Is our tour model the MH755 or MH750?
About the distortion measurements: Tyll used to test at 90 dB and 100 dB SPL when he ran InnerFidelity. The other sites test at 94 dB at 500 Hz. I suppose we could optionally add another test at 100 dB just to see how much worse the distortion gets. It might be instructive to see the difference between distortion measurements made by the sweep vs. stepped sine.
I had some discussions with @castleofargh on another thread about this. There's something weird about the Innerfidelity THD measurements in that, as @castleofargh pointed out to me, what they're actually plotting is THD+N as a percentage (I presume with reference to the test signal RMS). I think that's not a good choice, because we don't really care about the performance of InnerFidelity's air conditioning system. You'll notice in many of their plots, especially for open-backed or ported headphones, that their THD+N% is higher at 90 dB than it is 100 dB, because (presumably?) their A/C contributed to a greater proportion of the overall signal at the lower SPLs. That gives a false image of an IEM's distortion w.r.t. amplitude.
The ER2SE isolates reasonably well, so should be less prone to outside noise pollution. But I think we should aim to plot only THD or THD%. I share @castleofargh's concerns about doing THD measurements at 94 dB. With multiple points per octave, multiple-averaged stepped sine, there's a good chance somebody's going to break something Besides, I don't listen at anywhere close to those volumes, so from a purely selfish point of view I don't really care what the THD is at 94 dB. Lower SPLs would place less stress on the IEM and give less risk of distortions from the mic. So I think 94 dB for FR is fine, but I've been using 80 dB for THD. I think that's doable with a nicely-isolating IEM like the ER2SE. It could be more challenging for our ported Sony. I don't mind re-doing my THD measurements at a different SPL. What number should we choose? Something higher than 80 dB, but less than 90 dB???
@McMadface has been giving permissions to those on the tour once they receive the IEM and need to upload their measurement data. I like what he's doing there, as it gives people an incentive to join the tour and add their own measurements. Plus, there's personal data in that shared folder that probably shouldn't be posted publicly.
I updated the first post with @yuriv's recommendations to use a reference level for FR of 94 dB at 500 Hz. We haven't had any official votes in for SPL levels for THD, so can I vote for 80 dB and then win by virtue of having the most votes?
The ER2SE has a rising response at 1k. Also, I've noticed some variation in measurements made with these IEC60318-4 compliant couplers around that region. The coupler's first internal volume (the one with three slits) has a Helmholtz resonance around 1.19 kHz if I'm not mistaken in my calculations. So any variation on the size of the slits or the volume of the cavity will have an effect on the coupler's response around there. I've noticed it with the two couplers that I have. Measurements of Etymotic IEMs online show slightly different bumps around there too. Is the IEM really doing that, or is it the coupler?
I don't think I appreciated the significance of @yuriv's comments here on first reading, but this might end up being the most profound paragraph of this entire thread. I went back and looked at measurements from various couplers with all mic compensations off, and I see the same thing. In this region, it has to be an IEM and/or coupler issue - very unlikely to be anything to do with the coupler microphone. I believe the biggest variation between couplers (particularly between official GRAS 711 couplers and the Chinese-cloned couplers) is indeed in that region, with the GRAS 711 coupler showing an earlier rise with several headphones - so I think it's a more widespread issue than just the ER2SE. If I offset the plots based on OASPL, agreement looks pretty good. But if I offset the plots at 1 kHz (that funky region where the couplers disagree) it throws off the agreement over a wider range of the bass and midrange. It's a small region of disagreement and not critical to the absolute results (if our SPL levels are off by a bit, the FR of the ER2SE won't care), but it becomes fairly critical if 1 kHz is the point chosen to normalize the plots. Which it almost always is.
Any volunteers to take a hacksaw to their coupler, count the number and size of resonance chambers inside and make sure they sum to 1275 mm^3?
I updated the first post with @yuriv's recommendations to use a reference level for FR of 94 dB at 500 Hz. We haven't had any official votes in for SPL levels for THD, so can I vote for 80 dB and then win by virtue of having the most votes?
I don't think I appreciated the significance of @yuriv's comments here on first reading, but this might end up being the most profound paragraph of this entire thread. I went back and looked at measurements from various couplers with all mic compensations off, and I see the same thing. In this region, it has to be an IEM and/or coupler issue - very unlikely to be anything to do with the coupler microphone. I believe the biggest variation between couplers (particularly between official GRAS 711 couplers and the Chinese-cloned couplers) is indeed in that region, with the GRAS 711 coupler showing an earlier rise with several headphones - so I think it's a more widespread issue than just the ER2SE. If I offset the plots based on OASPL, agreement looks pretty good. But if I offset the plots at 1 kHz (that funky region where the couplers disagree) it throws off the agreement over a wider range of the bass and midrange. It's a small region of disagreement and not critical to the absolute results (if our SPL levels are off by a bit, the FR of the ER2SE won't care), but it becomes fairly critical if 1 kHz is the point chosen to normalize the plots. Which it is almost always is.
Any volunteers to take a hacksaw to their coupler, count the number and size of resonance chambers inside and make sure they sum to 1275 mm^3?
Do our ears have the same resonance? If so, then we would want the coupler to have the same resonance so that the graphs better plot what we're hearing. If I recall correctly, that's why we aim for a 8K peak when inserting the IEM into the coupler because our ear canals have a 8K resonance.
Do our ears have the same resonance? If so, then we would want the coupler to have the same resonance so that the graphs better plot what we're hearing. If I recall correctly, that's why we aim for a 8K peak when inserting the IEM into the coupler because our ear canals have a 8K resonance.
To add, was there any studies done on this matter with a large sample size of ears to determine variance of canal shapes for resonance frequency variations? Any papers? I curious if it's fairly consistant or there's a bit of variance.
The way this was described to me by Morten Wille (from GRAS) is that the 711 couplers' response is very close to a human ear. Meaning that somebody out there has an ear whose transfer impedance closely matches that of these 711 couplers. But that may not be you or me And for sure, there's variance.
The point that @yuriv was making is very specifically about the response around the 1 kHz region, where we typically normalize our graph plots. It looks to me as though there are subtle variations in the couplers' responses around this region. I don't know which of these couplers has the correct response for the average human ear in that region.
FWIW, I have never liked the idea of shooting for an 8 kHz resonance peak. Any resonance peaks are a function of the combination of ear/coupler and headphone. Deeply-inserted Etymotics will give you peaks much higher than 8 kHz. You can hear them (do a sine sweep). Headphones like the DUNU DK4001 have peaks around 7.5 kHz and there's nothing you can do to move them higher, because its geometry won't allow any deeper insertion. Using a very shallow insertion to force your Ety to show a ~8 kHz peak would give the impression (on the graph) that both headphones have resonance peaks at roughly the same location. But that's obviously not true, because nobody would use an Etymotic like that.
This site uses cookies to help personalise content, tailor your experience and to keep you logged in if you register.
By continuing to use this site, you are consenting to our use of cookies.


")
